- The Financial Times – Someone is wrong on the internet, wages and the stock market edition
Considering how the markets had been doing in the few months leading up to the BLS survey, it is not surprising that investment bankers and traders would have been recording large average pay increases. The FT recently had stories about how 2018 was shaping up to be a banner year for both IPOs and M&A. It would certainly be ironic if financiers convinced themselves to sell stocks because of a single data release, which had been distorted by their own aggressive pay packets, which in turn were based on a market melt-up partly justified by the stability of inflation…
Summary
Comment
We discussed the growth in wages last week:
A big beat by average hourly earnings (2.9% vs 2.6% est) is appearing to validate the jump in U.S. Treasury yields across the curve. Recent yield curve steepening is coming by way of rising rate hike timing and inflation expectations. But, we need at least another month of wage growth considering the drop in average hours worked (34.3) and supervisory and technology-focused jobs accruing the greatest gains.
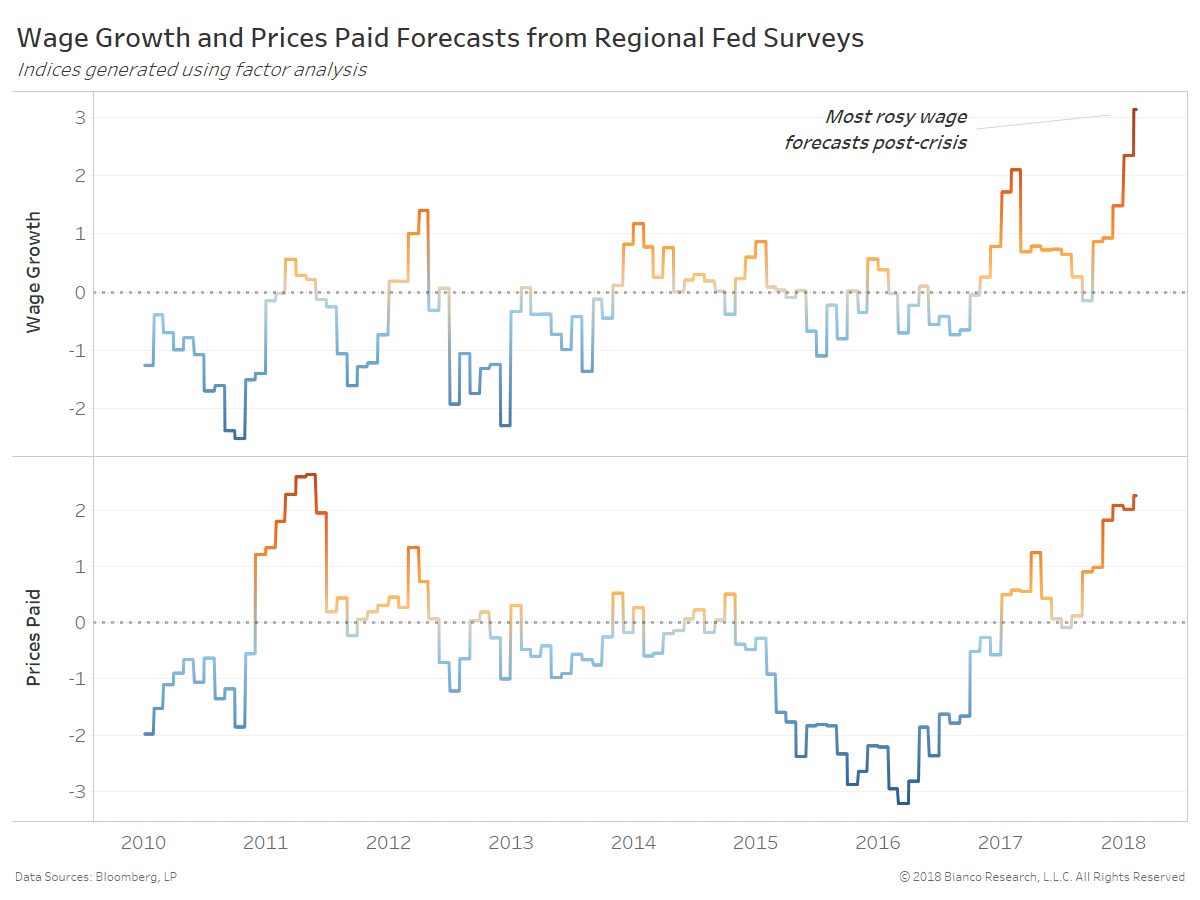
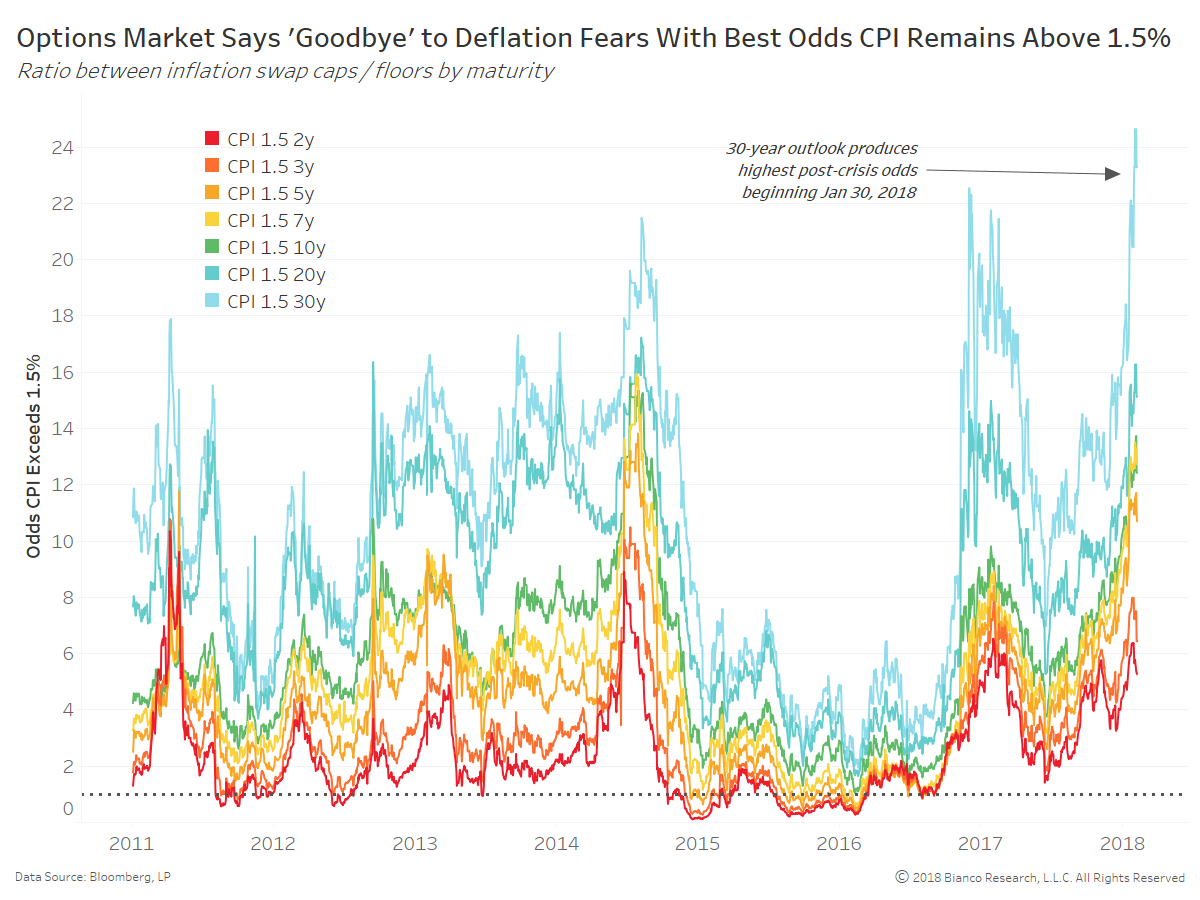
Wage growth and prices paid forecasts from regional Fed surveys are their most rosy post-crisis. Below we show indices compiling these numerous surveys. Wage growth, in particular, is breaking out in the wake of stronger supervisor wage growth, minimum wage bumps, and corporate tax cuts. We have argued higher wages are of course a very positive dynamic, but the markets and the economy will move on to demand greater consumer spending to follow.
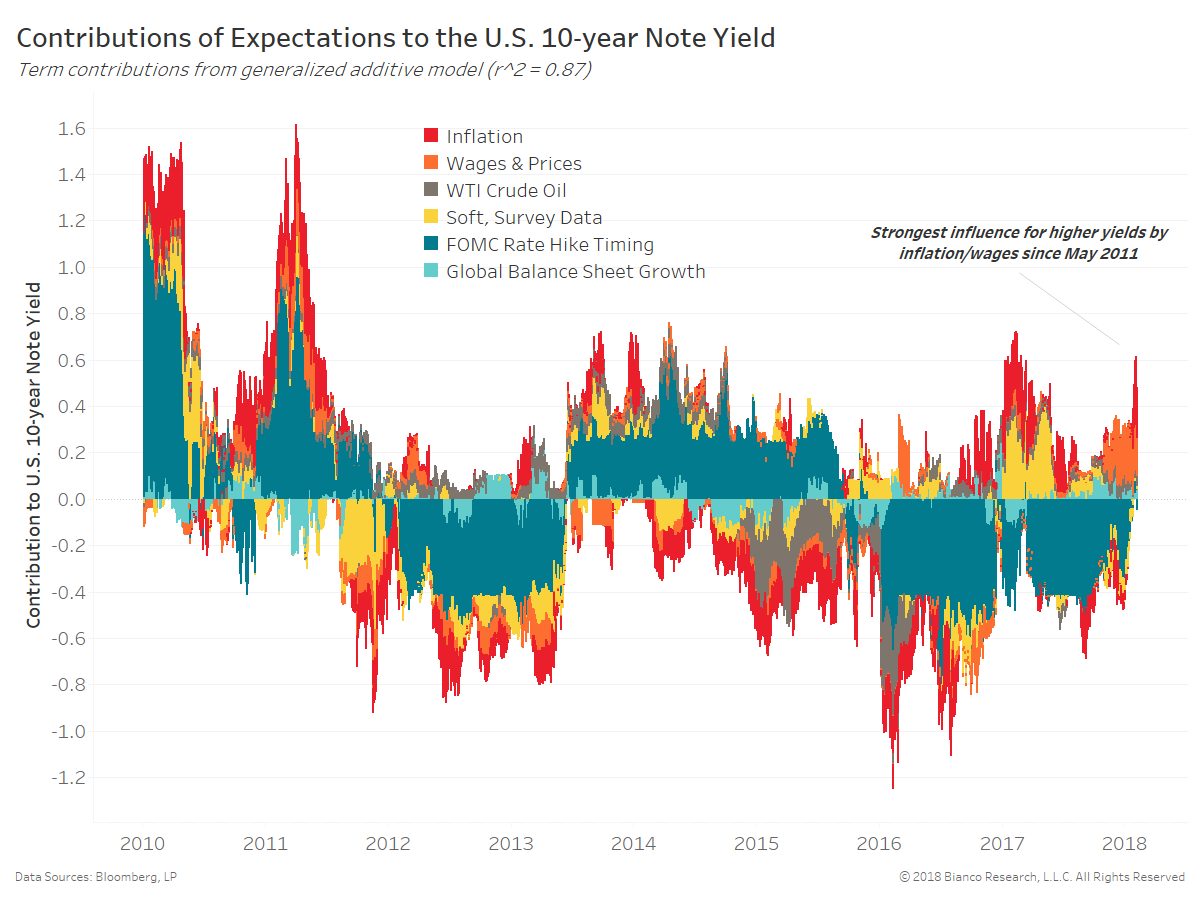
The next chart shows the contribution of expectations to nominal U.S. 10-year note yields since 2010:
- Inflation – News trends for ‘higher inflation’
- Wages & Prices – Composite of regional Fed wage/price forecasts
- WTI Crude Oil – 3-month forward
- Soft, Survey Data – Citigroup Soft Economic Data Change Index
- FOMC Rate Hike Timing – Morgan Stanley’s Pace of Rate Hikes for FOMC
- Global Balance Sheet Growth – 6-month change in Fed, ECB, BoE, and PBOC total assets
*Intercept (or mean) of 2.36%
Inflation (red) and wages/price forecasts (orange) are offering their highest contributions since May 2011. Additionally, the pace of tightening by the Fed (dark teal) is beginning to pressure yields higher for the first time since mid-2015.
All in all, inflationary fears are impacting Treasury yields by nearly the greatest degree since the crisis. Matthew C. Klein’s question of whether or not wage gains trickle down from supervisors and technology jobs is THE issue for both U.S. Treasury yields and risk asset volatility. We find no coincidence the inflation expectation breakouts shown above and an additional rate hike added to 2019 were met with a dramatic burst in equity volatility (i.e. VIX). Again, volatility follows a simple equation using economic growth, inflation, and rate hike timing.
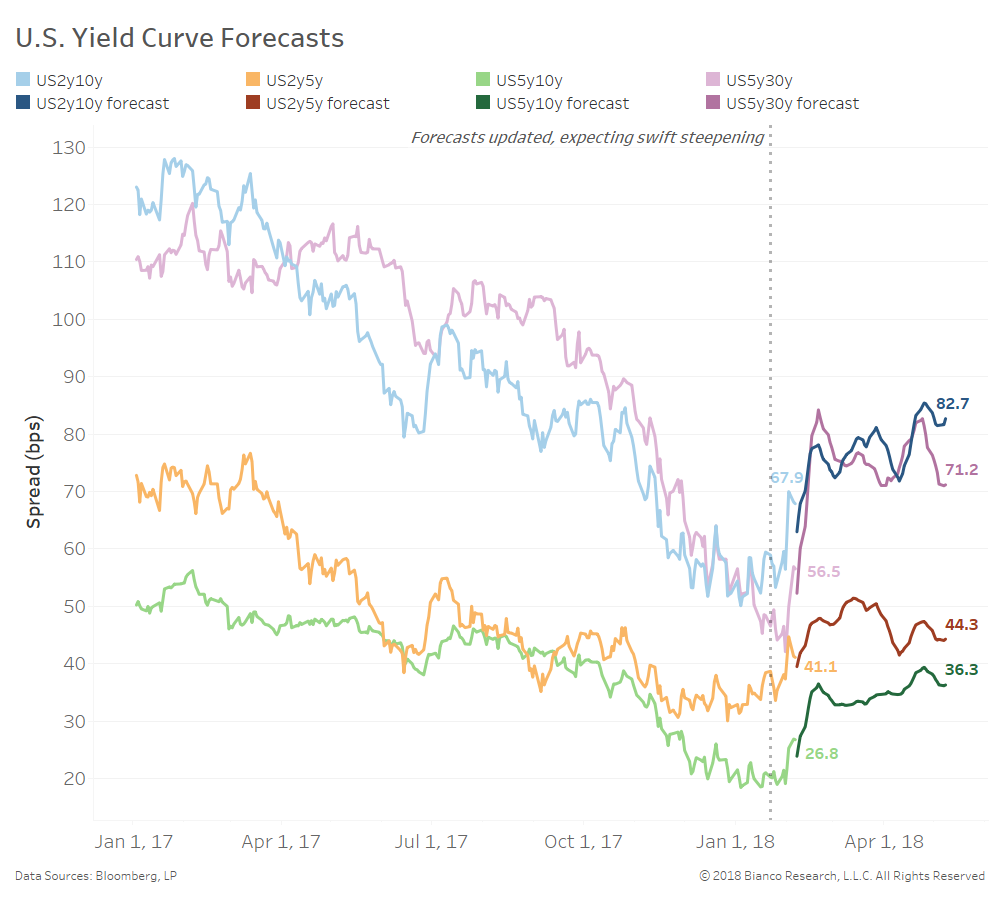
Lastly, higher volatility and still-elevated inflation expectations leave room for further U.S. Treasury curve steepening. Our last update producing steepening forecasts on January 22nd have mostly come to fruition.
We have expanded the lookback used to train these models to pre-crisis, while also adding the MOVE index and bank stocks’ relative performance to the S&P 500. A deeper look back and consideration of risks have dampened the outlook for steepening. The 2-year 10-year has the potential to steepen just above 80 bps.
The long-term flattening trend is likely still intact barring a more significant drawdown across equity markets. We will be watching these models closely to see when curve forecasts potentially roll back over toward flattening.