Comment

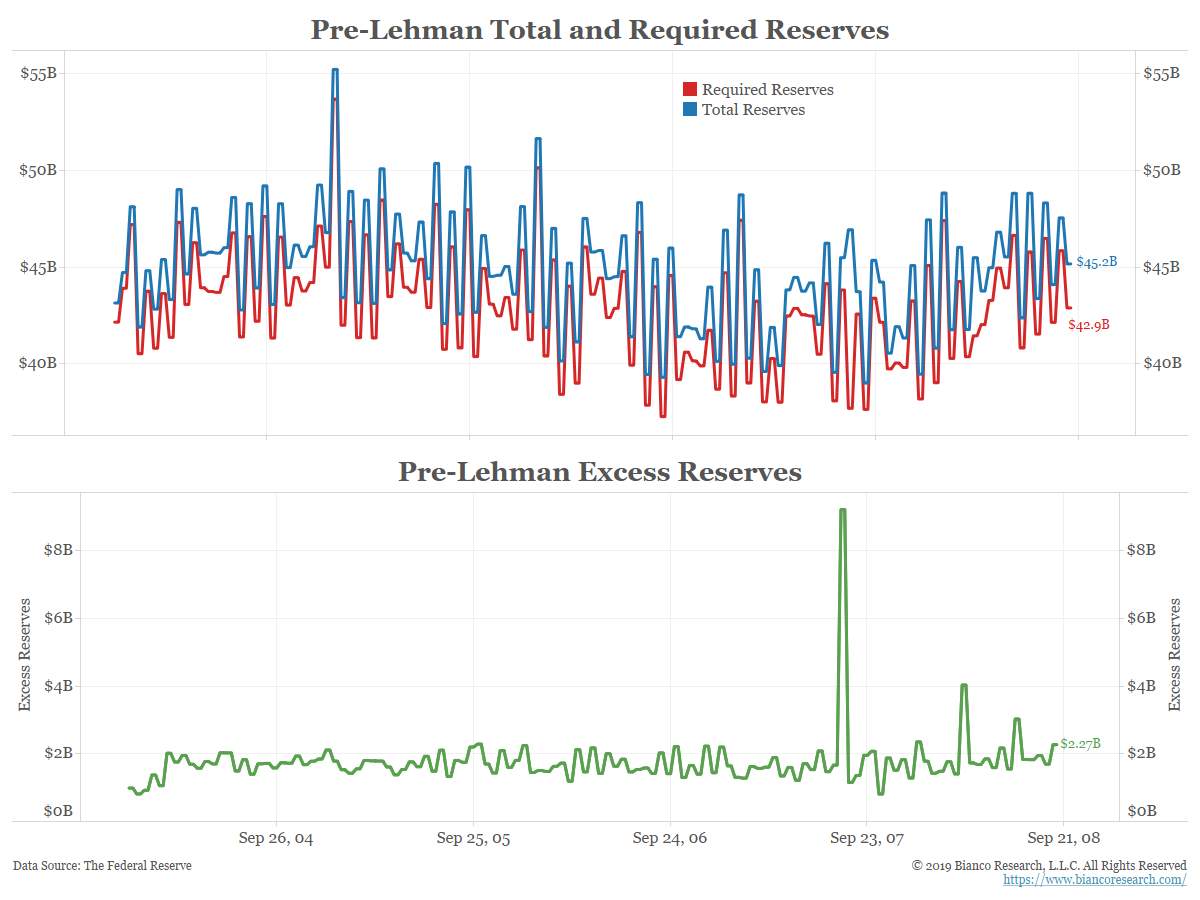
The reason this market has essentially disappeared is that all the banks are over-reserved. As the blue line in the chart below shows, banks held an average of $45 billion in total reserves prior to Lehman’s bankruptcy. As the red line shows, required reserves were roughly $43 billion. The green line shows the difference between these two series, known as excess reserves.
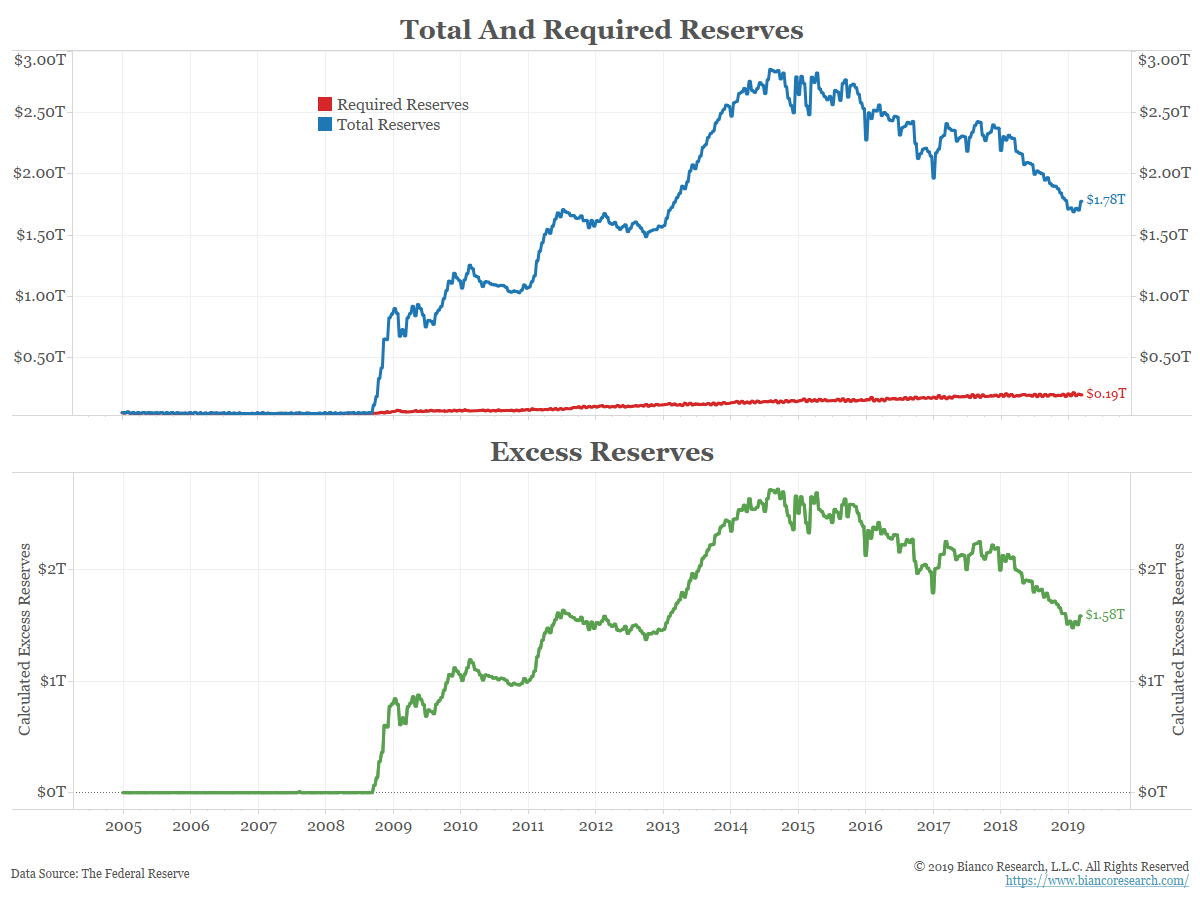
Prior to the Great Recession, the Federal Reserve would manipulate the level of required reserves to push interest rates up or down. Once QE became a reality, the game changed. The Fed would buy bonds directly from the primary banks. In order to pay for the bonds, they would simply change the level of reserves a bank held. For example, if they bought $10 million in bonds from Citibank, they would add $10 million to Citi’s reserves. They essentially printed money out of thin air.
The green line in the chart below shows the effect this had on the level of excess reserves held at the banks. Virtually every single bank became massively over-reserved. The fed funds market, which was a tool for banks to trade reserves to meet the Fed’s requirements, became useless to domestic banks. There are some foreign banks that are not regulated by the Federal Reserve that are allowed to access this market. Outside of this small group, this market is essentially a symbolic memory of how things used to work.
Excess reserves would have to get back to pre-crisis levels for this market to function normally again, but that is unlikely to happen with the Fed announcing an end to balance sheet reductions.
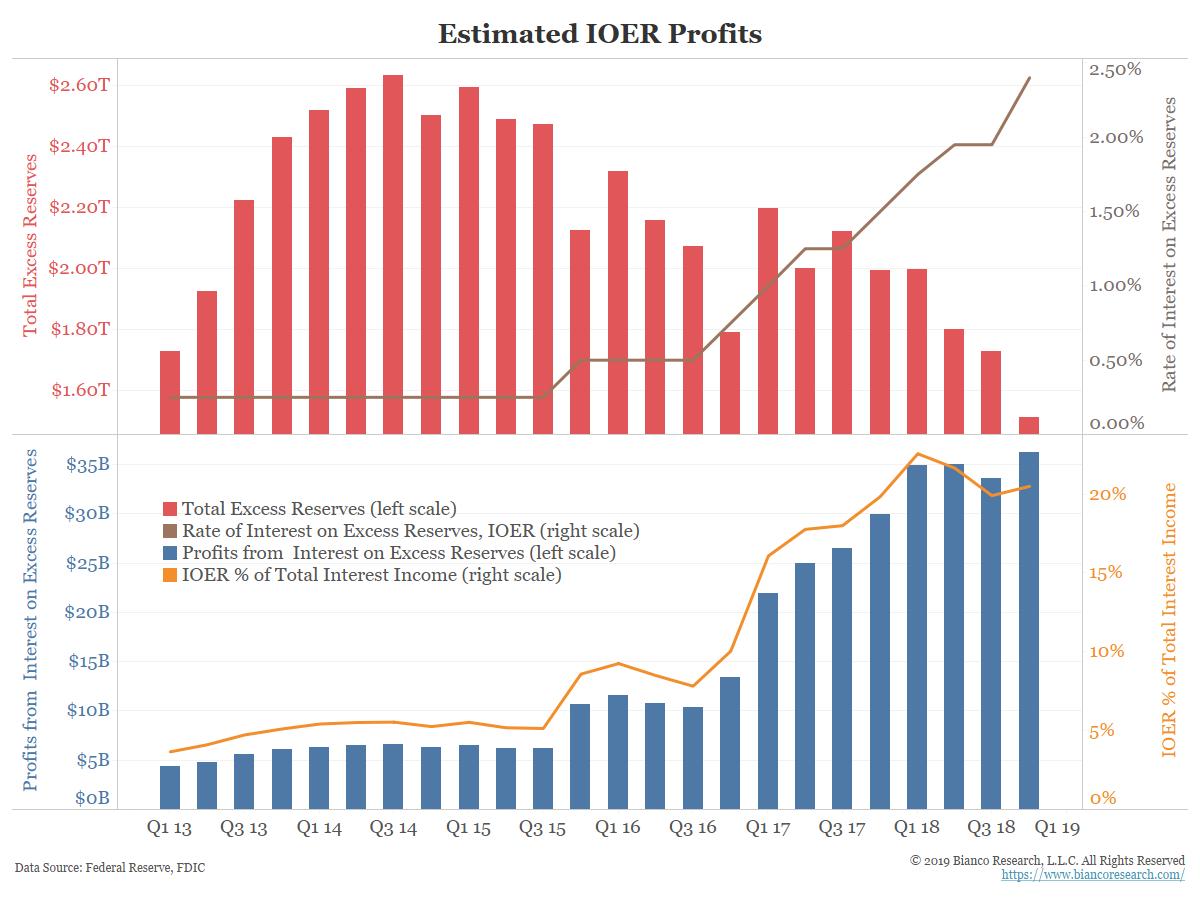
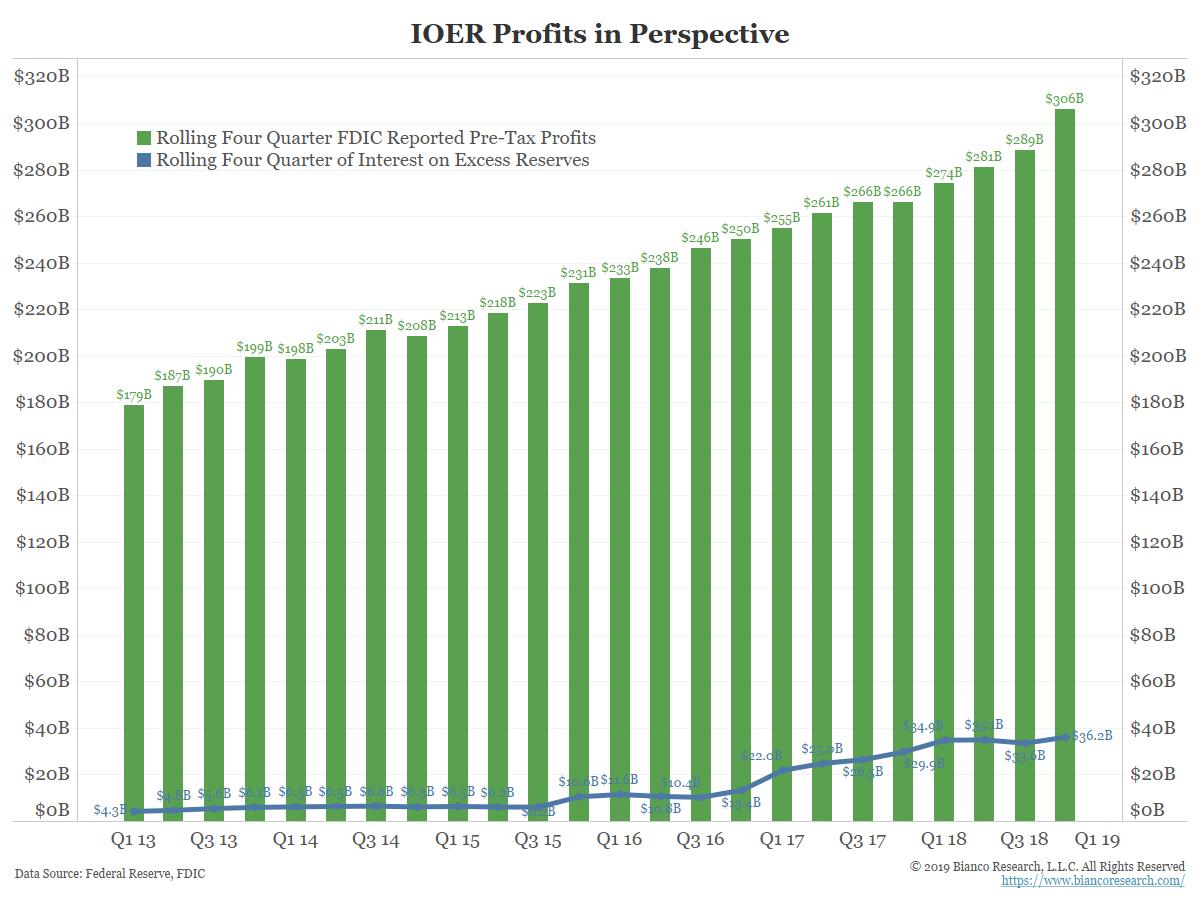
While the banks are not going to turn down free money, IOER does not make up a large portion of their profitability. However, the Fed may find itself under a bit more pressure than usual if this becomes a topic of debate this election season. The Fed would like to continue using IOER as a policy tool, but what happens if someone like Alexandria Ocasio-Cortez starts to question why the banks continue to get this subsidy? It would be easy enough to vilify the Jamie Dimons of the world.
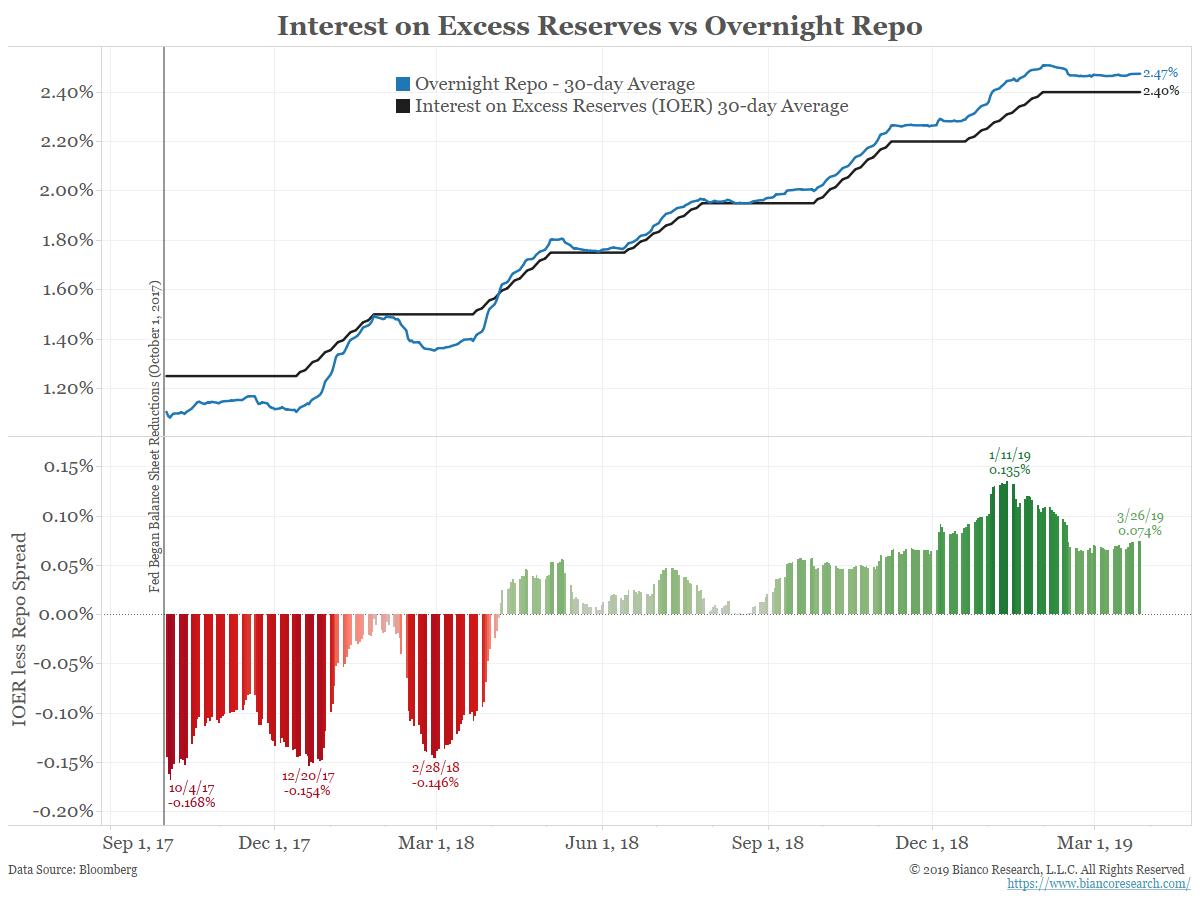
At some point, the Federal Reserve will have to figure out a different way of conducting policy. They can’t simply walk away from IOER, because that is effectively how they control interest rates. As balance sheet reductions come to an end and these excess reserves remain parked at the banks, the old way of conducting policy may not remain tenable for very long.