- The Heritage Foundation – (February 6, 2023) Is U.S. Monthly Jobs Report Still Reliable or the Last Domino To Fall?
Another question on the reliability of our statistics lies in how these numbers are collected. The BLS relies on surveys to compose these reports, and the response rates for the surveys have been falling significantly. For example, the jobs openings figure—closely watched by the Federal Reserve—is from a survey with an appallingly low response rate of just 30.6 percent. There could be considerable bias in the surveys used by BLS, especially in the preliminary estimates which have the lowest response rates. Other statistical phenomena have also been affecting the headline jobs number, such as multiple job holders trending up while people shift from unincorporated self-employment to work elsewhere. Admittedly though, those trends and the other statistical anomalies may not entirely explain the very large increase in January’s nonfarm payrolls nor much of the increase over the last year.
Summary
Comment
The Bureau of Labor Statistics (BLS) uses surveys, even though actual data could be used.
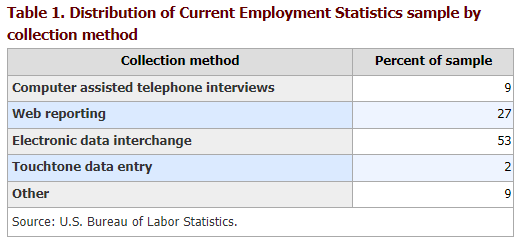
For payrolls, the BLS collects the payroll records of a sample of business establishments. Each month the program surveys about 131,000 businesses and government agencies, representing approximately 670,000 individual worksites. This represents about one-third of all payroll jobs. The following table shows how they collect the data.
(Note that “electronic data interchange” means payroll data is automatically sent to the BLS by a company’s payroll processing firm. This is over half of the survey sample collected by the BLS.)
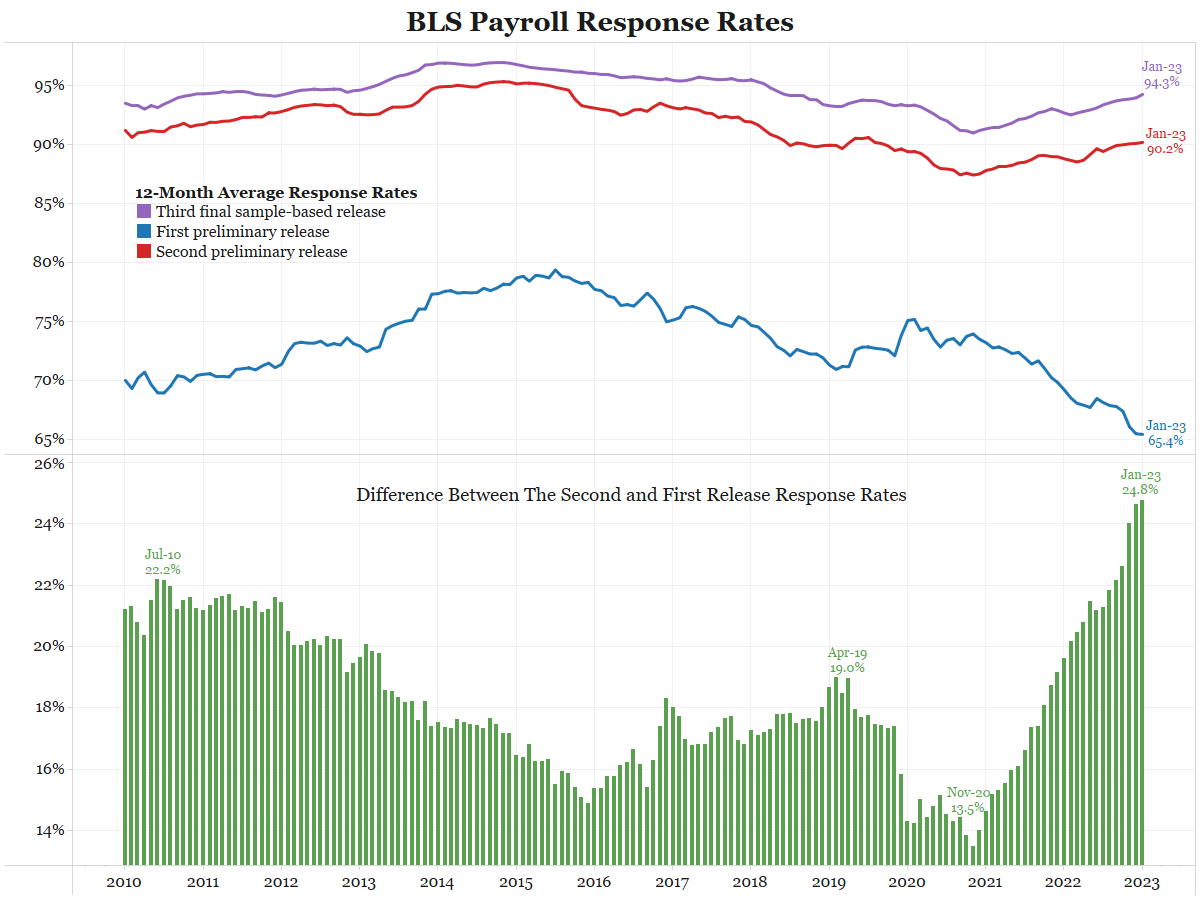
But as the next chart shows, the response rate to the survey, despite advancements in data collection, is declining.
Why? Political polling has so soured everyone to “surveys” that people are actively opting out of participating, no matter the reason for the poll.
The first-release response rate (blue line) has been falling for the last several years. As the green bottom bars show, the response rate for the second release (red line, top panel) is now about 25% larger than the first release.
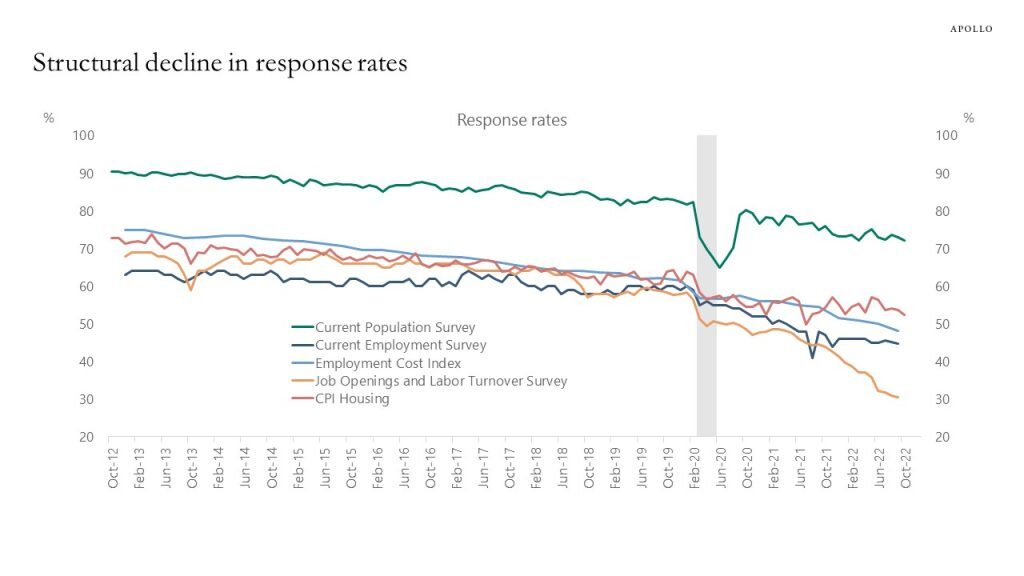
As Torsten Slok of Apollo noted last month, the payroll report is not alone. Many surveys’ response rates are falling.
The JOLTS report (gold line), which Powell follows closely, only has a 30% response rate, noted in the story above.
Conclusion
The solution for many of these surveys is to move away from them. The most practical route would be a link between IRS withholding data and BLS reporting. This is a large ask for two slow bureaucratic organizations with antiqued computer systems. So the BLS continues to survey for payrolls much as they have done since the end of WW2, albeit with some updated techniques, like websites and electronic data collection (until 1983, this survey was 100% mail-in responses).
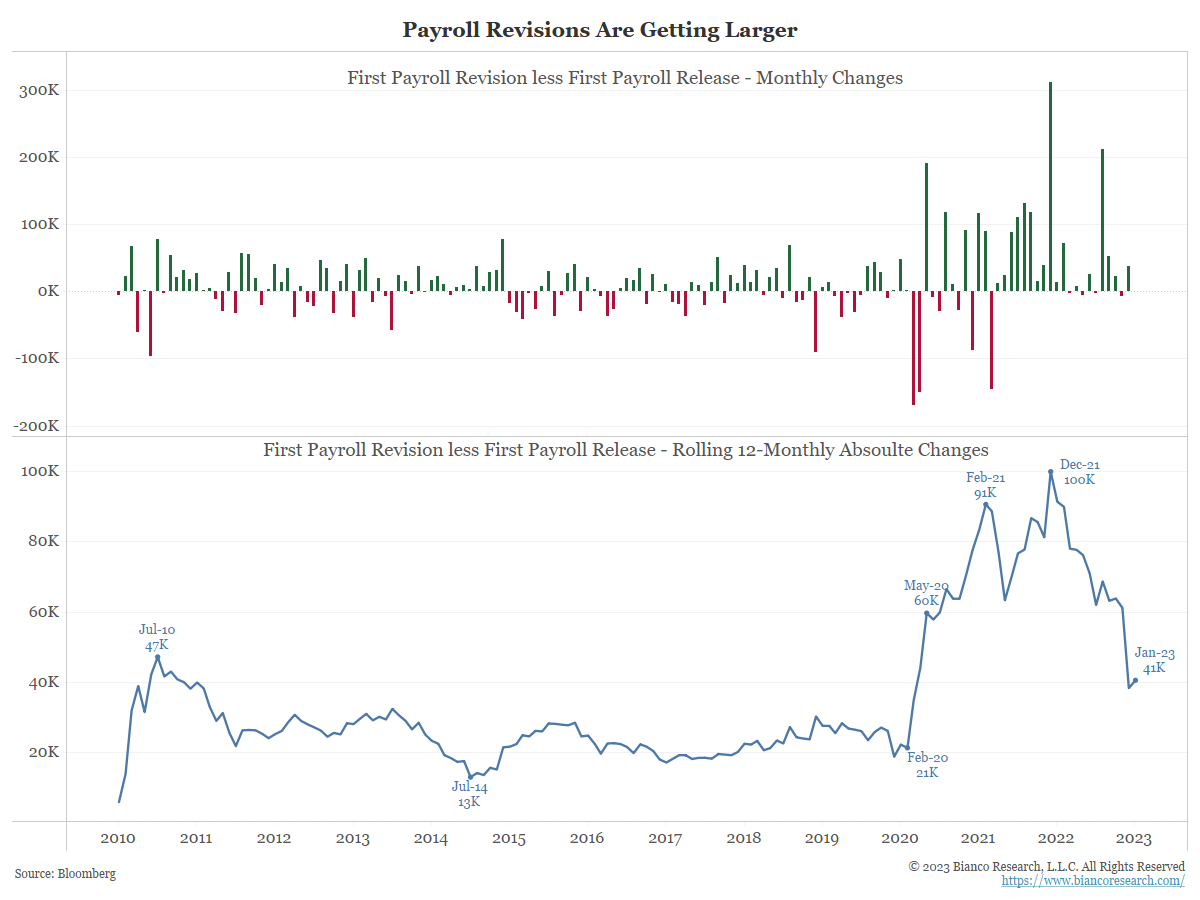
For now, all response rates are falling, and the size of revisions is growing. This means the error rate from these surveys is increasing.