-
- Bloomberg.com – Goldman Sachs says chance of a recession is now just 10%
* The Federal Reserve’s abrupt policy pivot has eased financial conditions and reduced the odds of a recession to just 10% over the next four quarters, from 20% at the end of the fourth quarter, Goldman Sachs economists said.
* The economists studied the reasons for the easier financial conditions and said the Fed was largely responsible.
* The Fed’s dovish shift was seen as an intentional effort to reduce downside risks and it appears to have worked as planned, they said.
“The Fed’s dovish shift was likely designed to decrease downside risks, and our findings suggest that this has largely worked as planned. As the lingering effects of the Q4 tightening gradually fade away, the Fed may eventually be willing to revisit the need for patience, as indicated in the January minutes,” they wrote.
- Bloomberg.com – Goldman Sachs says chance of a recession is now just 10%
Summary
Comment
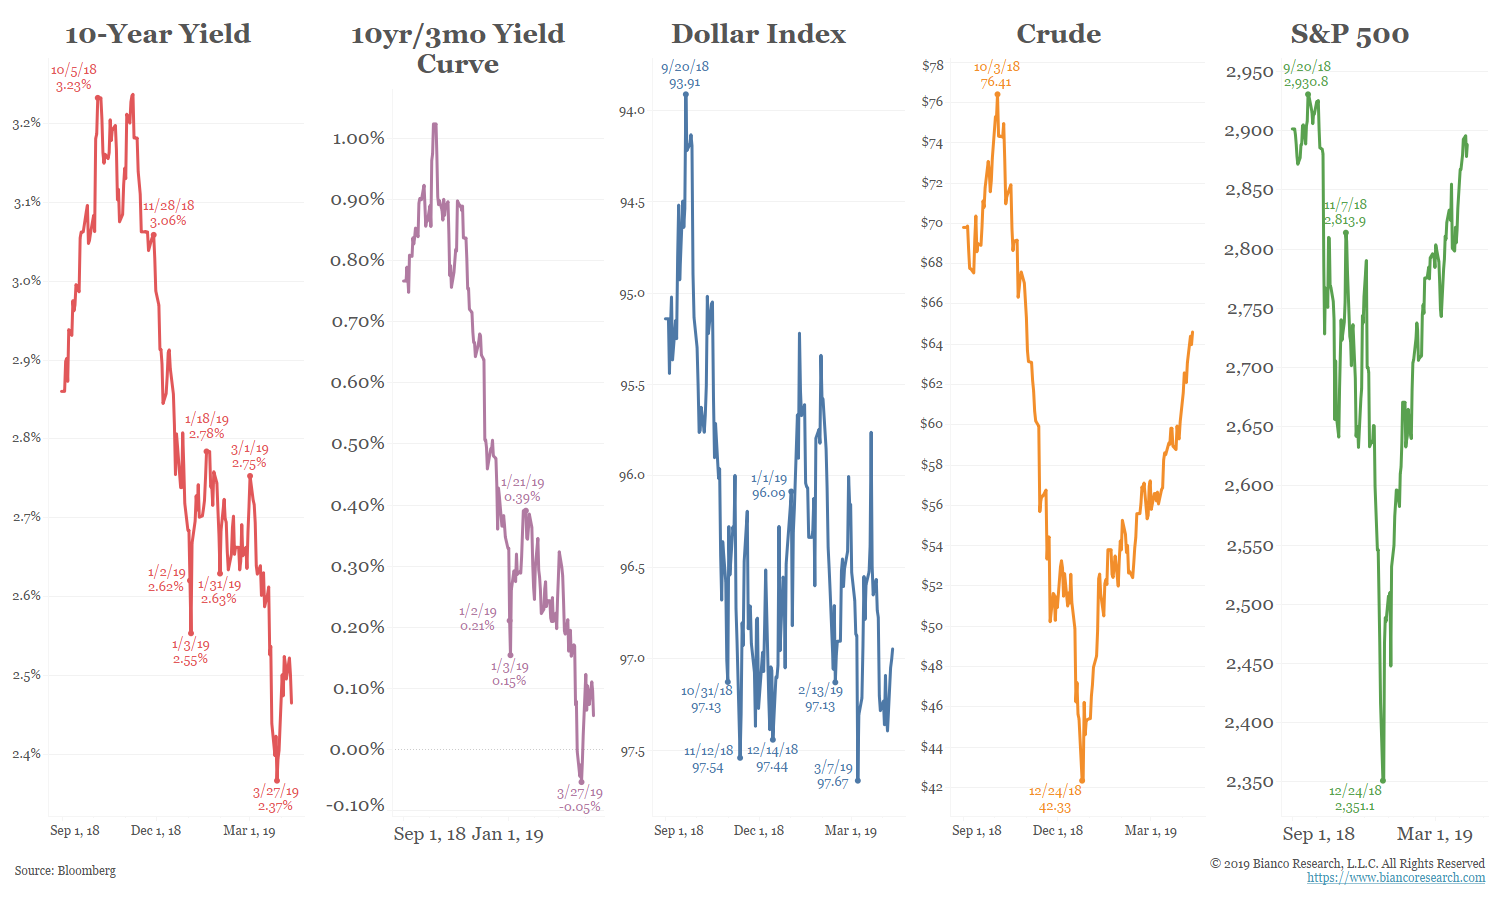
The chart below shows how five markets have traded since October 1, 2018.
On the left are the 10-year yield (red) and the 10-year/3-month yield curve (purple). They have continued lower.
On the right are crude oil (orange) and the S&P 500 (green). These markets have rebounded since December and are broadly in agreement with economists that the economy is in good shape.
In the middle is the dollar index (blue) and is trending sideways.
What Does The Bond Market See?
Simply put, weak data.
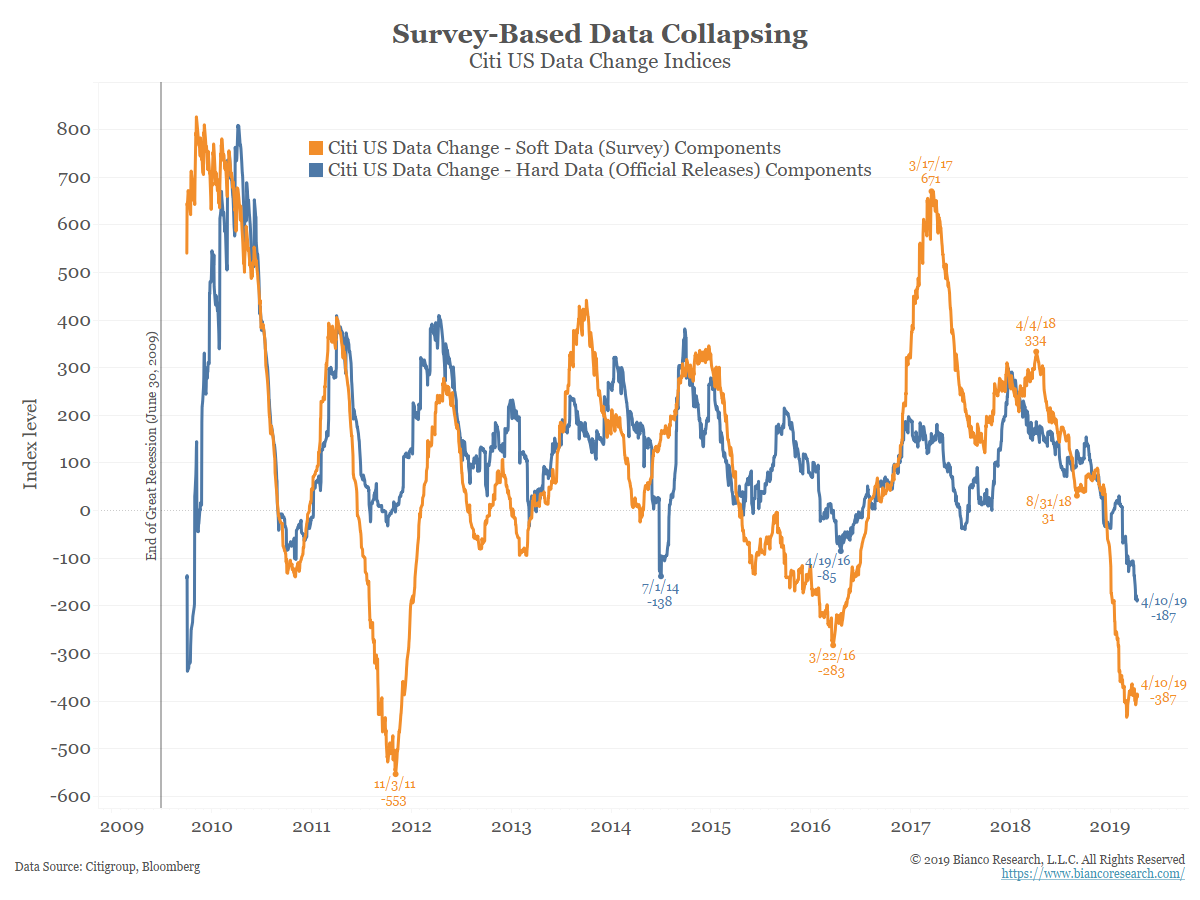
Below is the Citi Data Change index, which measures incoming data versus a one-year average. It can be broken down into two sub-components. The blue line shows hard data (official releases) while the orange line shows soft data (surveys).
Hard data (blue) remains in a downtrend and is at its lowest level in the post-crisis era. This suggests economic momentum has continued to slow.
Similarly, the soft data (orange) is close to its worst level of the last seven years. Despite the rebound in stock prices, it remains depressed.
Below are the last set of earnings estimates from Wall Street before the official reports start flooding in.
Q1 2019 earnings (green) are expected to fall nearly 4% from last year’s levels. Q2 2019 earnings (orange) are expected to rise just 0.56%. Both of these trends continue their march lower.
An earnings recession is often defined as two consecutive quarters of negative growth. While Q2 growth projections are not yet negative, there is still plenty of time for analysts to lower their estimates.
.040519.png)
What Does The Stock Market See?
Simply put, cheap money.
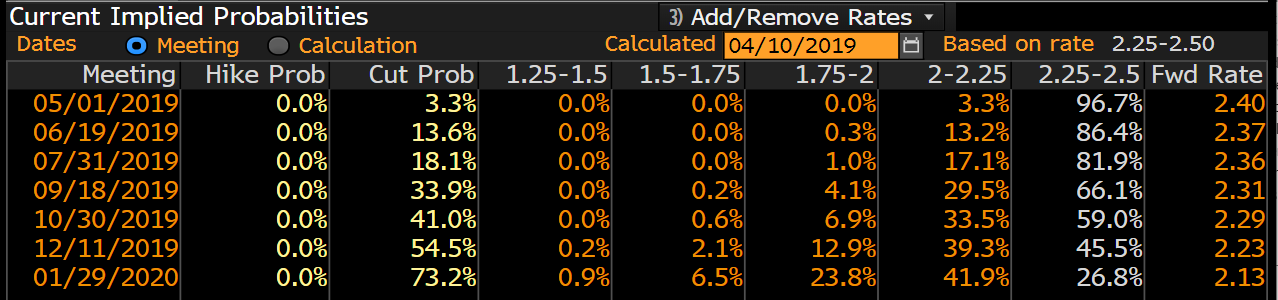
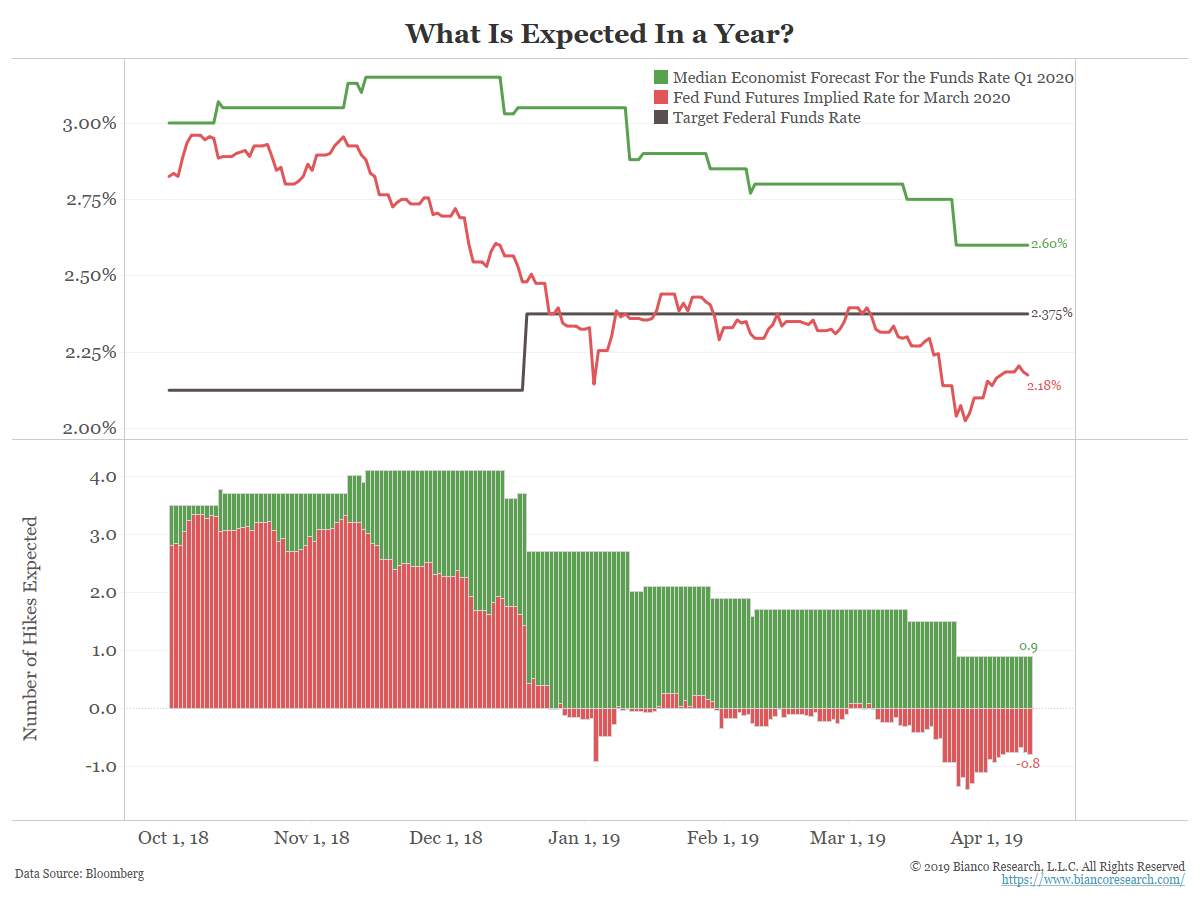
The Fed’s pivot from hikes to hold, compounded with the market expecting cuts later this year (table and chart below) has the stock market believing, yet again, the Fed has its back. This is what Goldman Sachs concluded in the story above.
.041019.png)
In fact, the Fed discussed this, as noted in the March 19-20, 20919 FOMC minutes, released yesterday:
Investor sentiment toward risky assets continued to improve over the intermeeting period. Market participants cited accommodative monetary policy communications and optimism for a trade deal between the United States and China as factors that contributed to the improvement.
Federal Reserve communications since the beginning of this year were seen as an important contributor to the recent improvements in financial conditions.
How does cheap money help? By keeping rates low allowing companies to borrow. Much of this borrowing goes to stock buybacks.
As the next chart shows, since the end of the Great Recession (June 2009), $4.7 trillion in cumulative buybacks have taken place (green line). The year ending Q4 2018 saw $806 billion in buybacks took place, a new record high (blue line). In the era of low rates, buybacks and M&A have become much more common and are showing no signs of slowing.
.041119.png)
Economists versus Markets
How Does This Get Resolved?