Q4 2017 Earnings Almost Complete

View PDF


Earnings

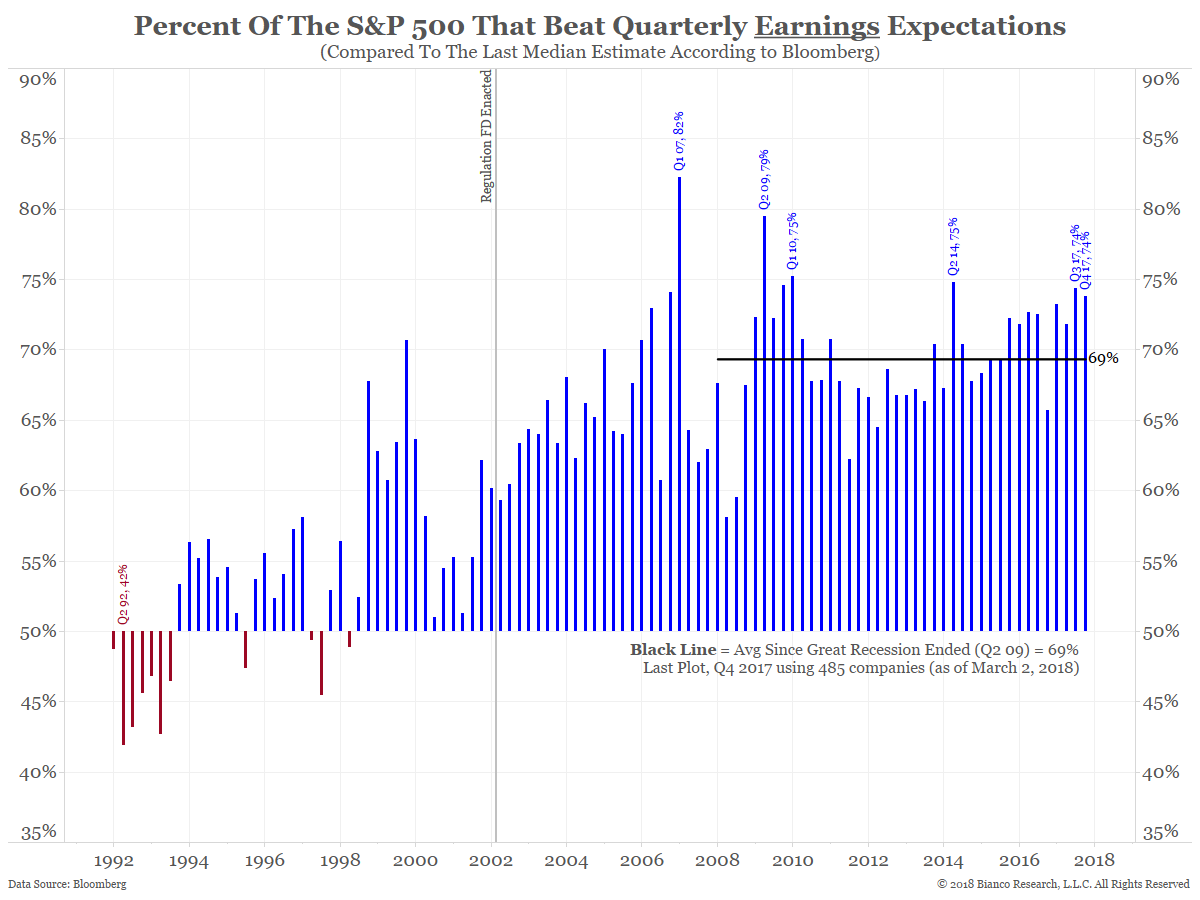
Through Friday, 485 (97%) of the S&P 500 companies have reported Q4 2017 results. As the chart below shows, 74% beat expectations. This is just below the highest post-crisis beat rate of 75% (Q3 2017, Q2 2014, Q1 2010).


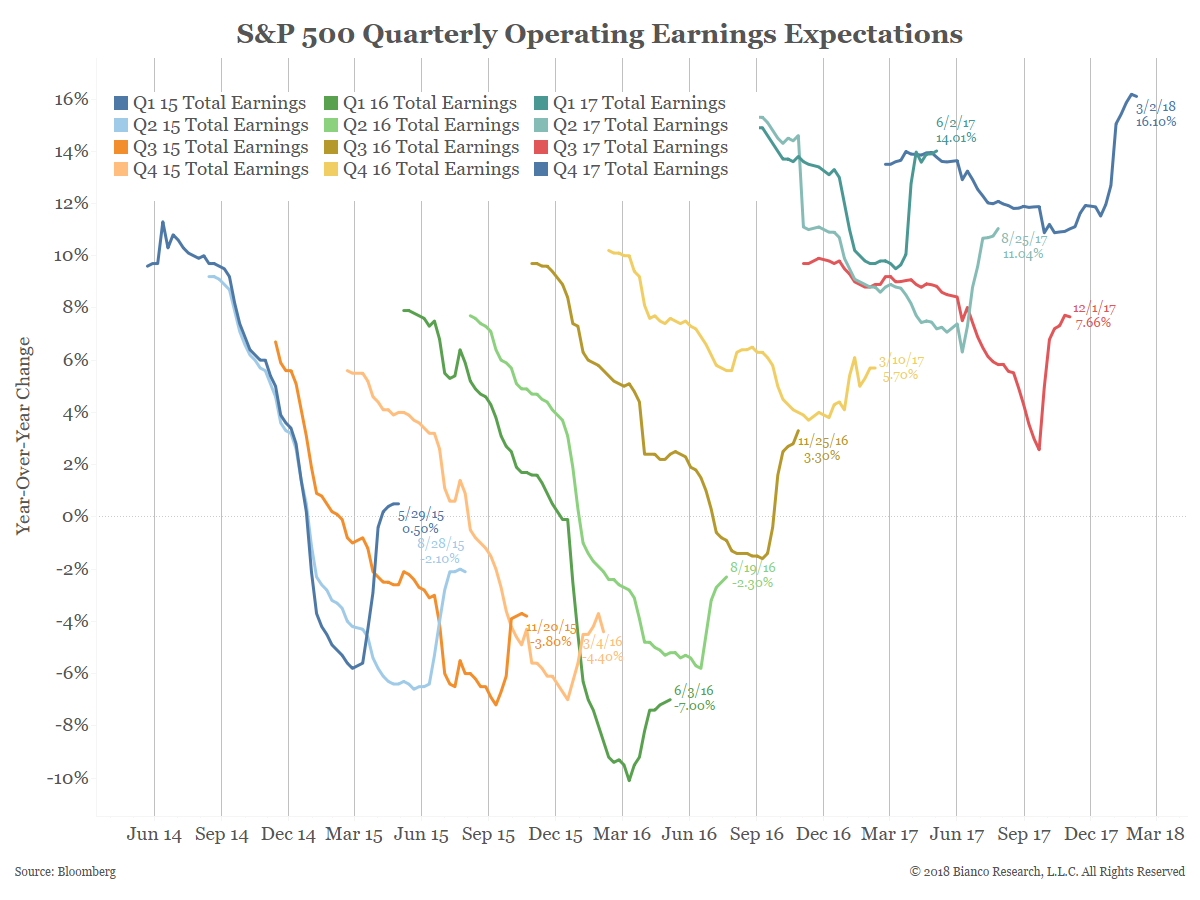
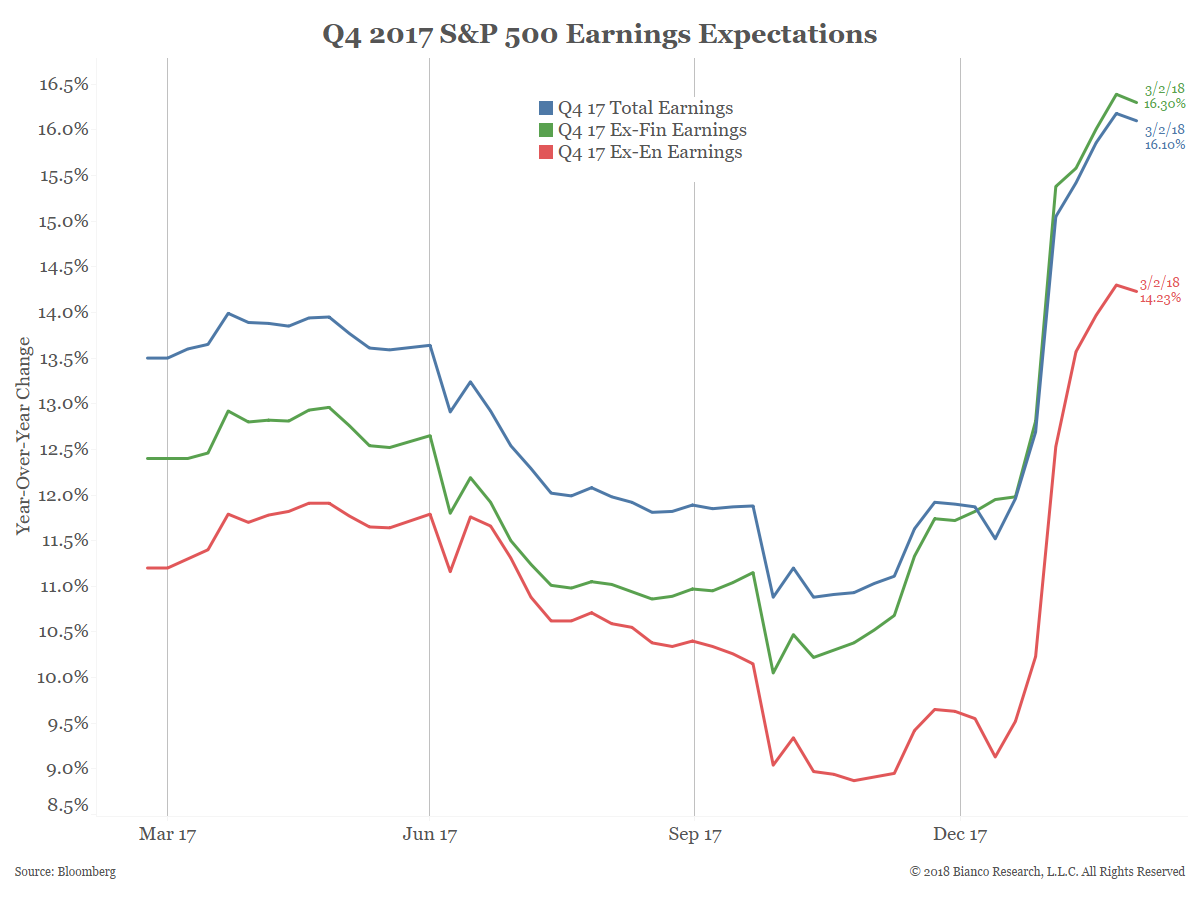
As the next chart shows, year-over-year operating earnings growth (blue line) is now over 16%. This is a blended chart which uses the 485 actual results and the median Wall Street estimates for the 15 companies that have not yet reported.

 
The chart below shows the expected operating earnings growth rate for Q4 2017 is now the highest of the last few years. In fact, if this growth rate holds through the next 15 reports, it will be the highest earnings growth rate since 2009/2010 when earnings rebounded after the Great Recession.


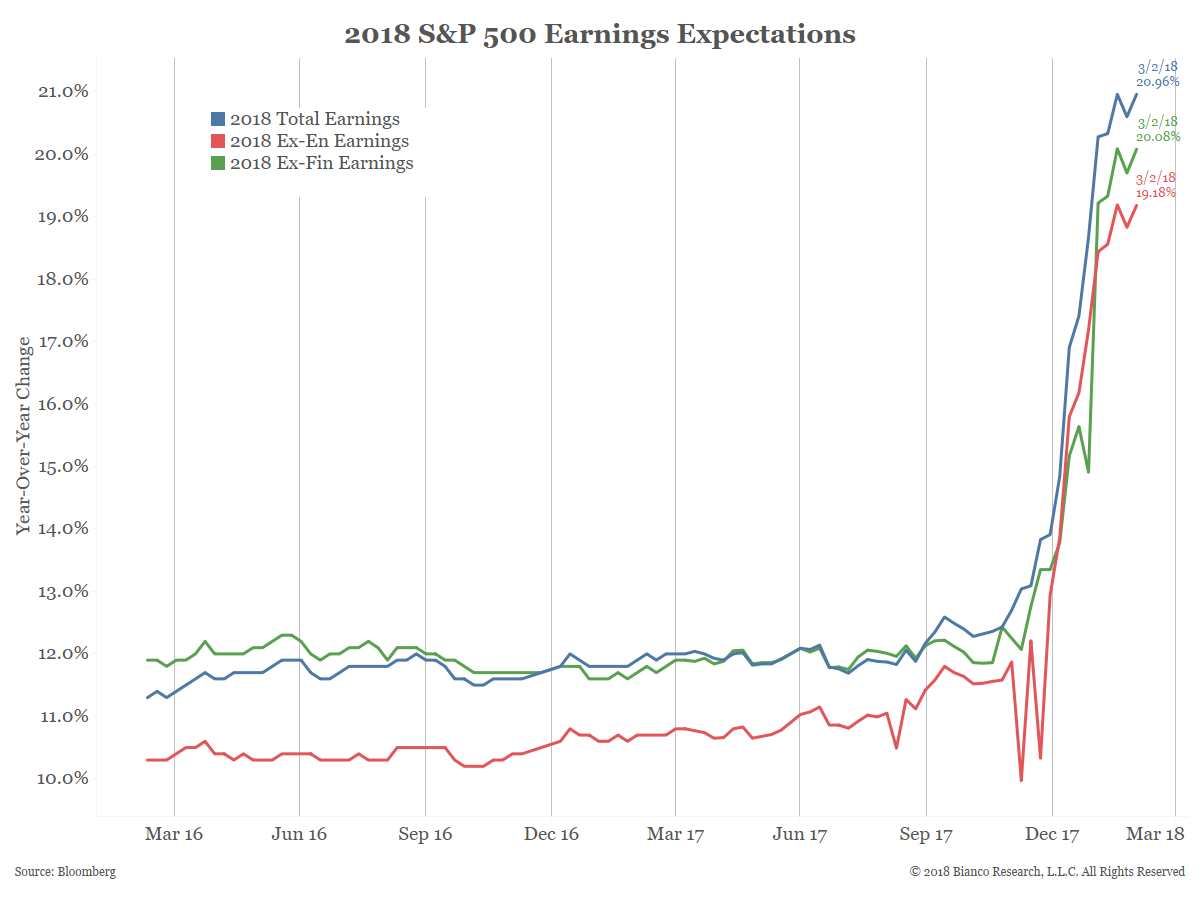
The blue line in the next chart shows earnings growth expectations for all of 2018 are almost 21%. Post-tax bill passage this metric has gone vertical.


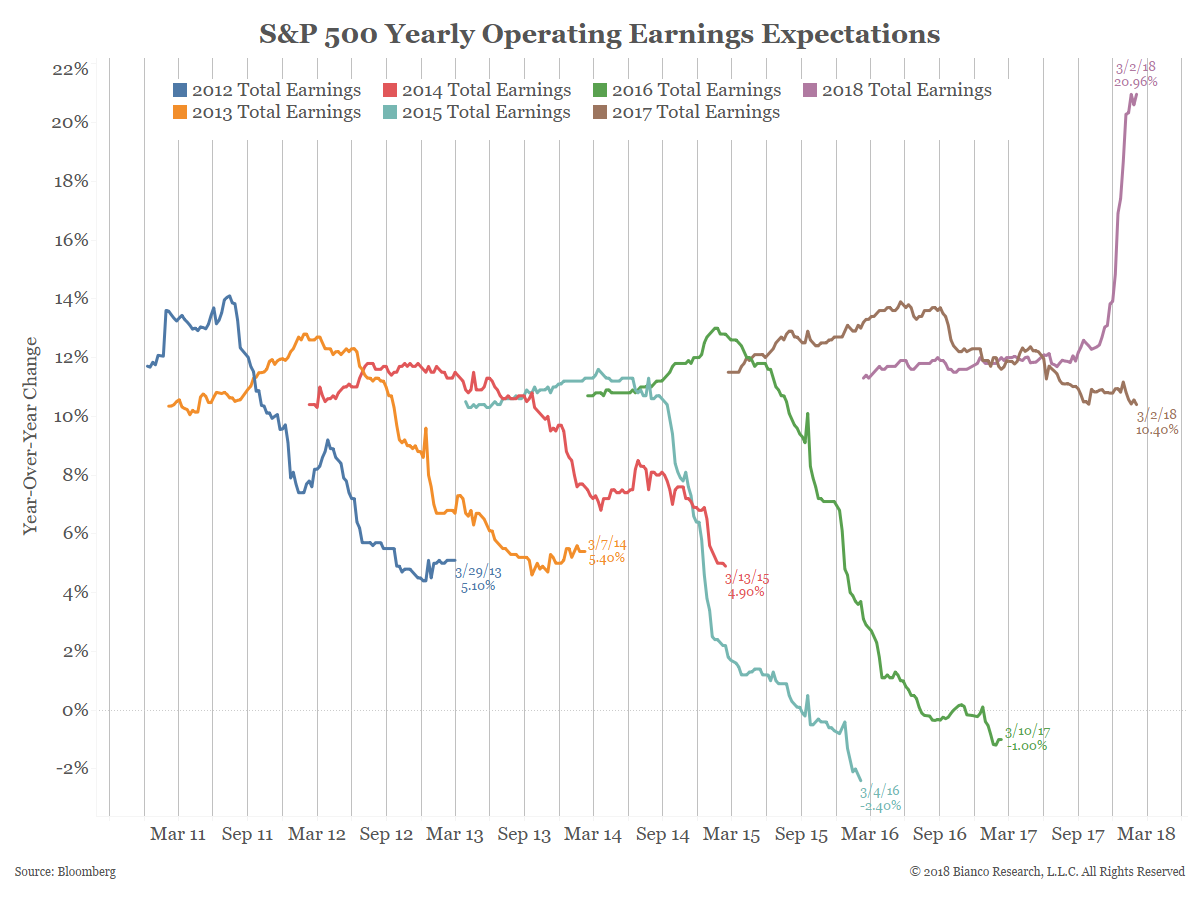
The next chart puts the full-year expectations into perspective. Quite simply, we have never seen anything like this.


The surge in earnings growth might be the biggest seen in nearly forty years of earnings data. The chart below, from Yardeni Research, shows all the yearly estimates back to 1980 (blue line), actual earnings growth (purple line) and rolling 12-month forward estimates (red line). We have not seen a turnaround in earnings expectations like we have in the last two months (2018 blue line), not even following the passage of the 1986 Tax Act. What is happening with earnings expectations is unprecedented.

View PDF


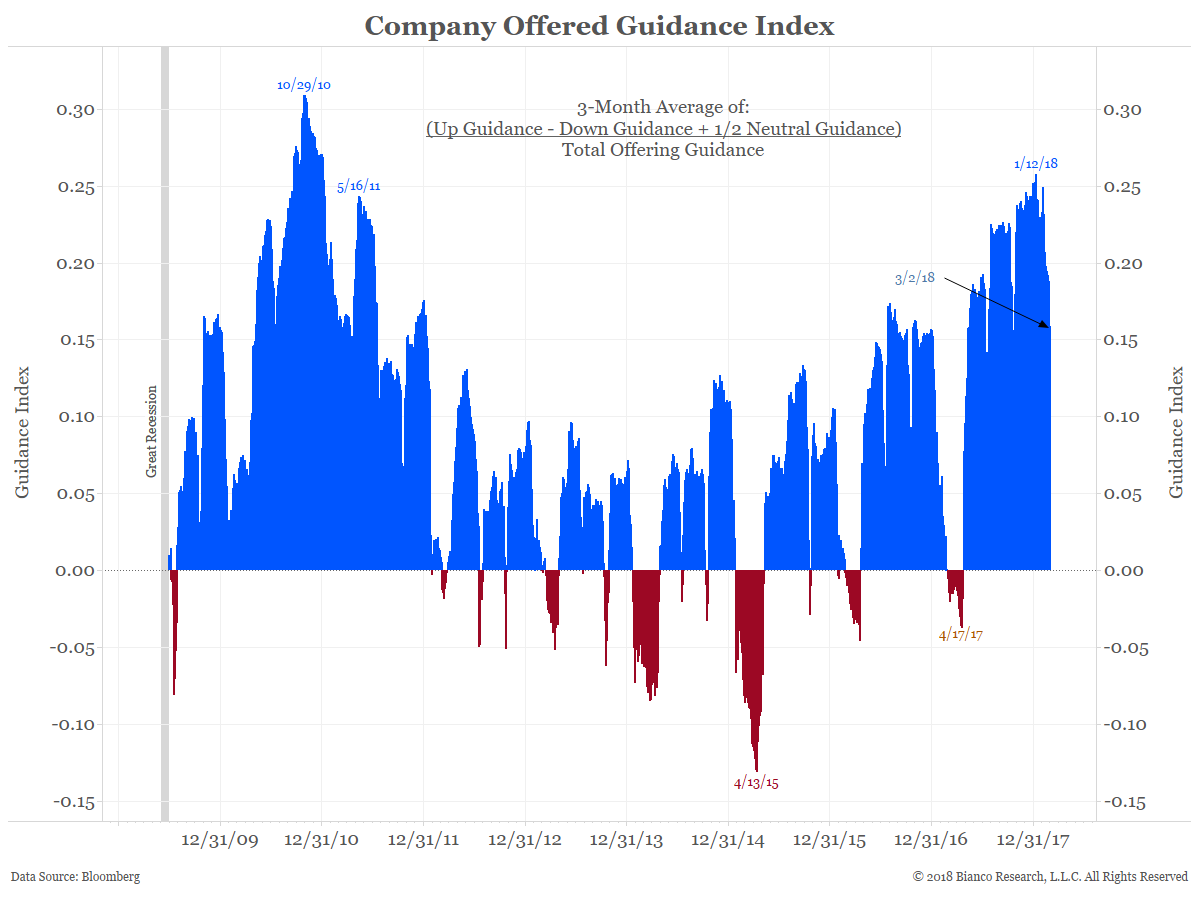
Finally, companies continue to be optimistic about the future. The next chart, which highlights the Guidance Index, shows companies are still offering guidance just off their most positive level in 8 years. But note that our metric is a three-month rolling sum. Two weeks ago FactSet noted the following about 2018 guidance:

Over the past several weeks, have S&P 500 companies been as optimistic as the industry analysts in terms of their annual EPS guidance for 2018?
The answer is yes. From December 31, 2017, through February 15, 127 S&P 500 companies have issued positive EPS guidance for 2018. This number is more than double the 10-year average of 49 for this same period.
In fact, this number marked the highest number of S&P 500 companies issuing positive EPS guidance for a year (through this point in time) since FactSet began tracking guidance data in 2007.


Revenues Booming Like Earnings

The next set of charts show S&P 500 revenues or sales. The fact that these are also so strong indicate the growth seen in earnings is not just about the tax cuts.

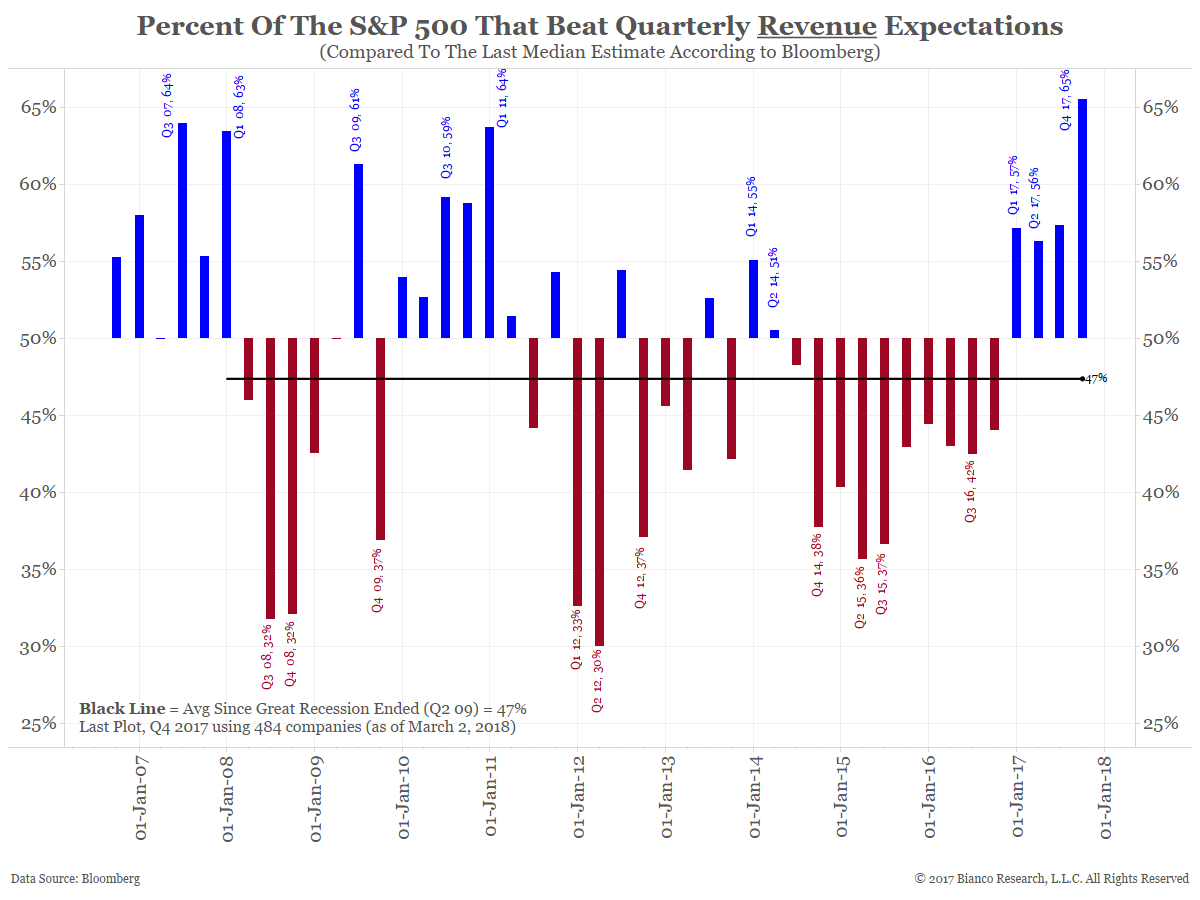
The chart below shows 65% of the 484 companies in the S&P 500 that have reported through Friday, March 2 beat expectations. If this rate holds as the final 16 companies report, it will be the highest beat rate in the post-crisis era.


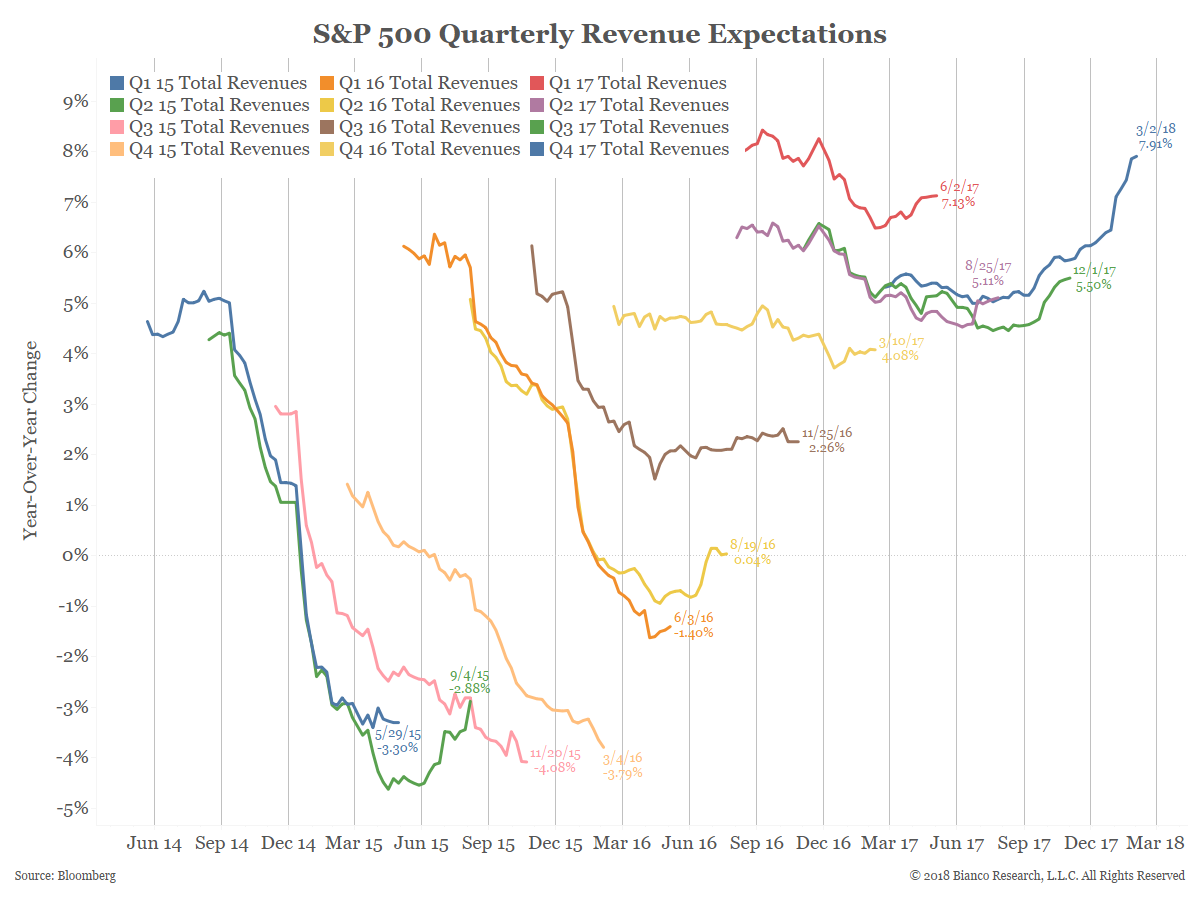
The next chart shows year-over-year revenue growth expectations for Q4 2017. A 7.91% growth rate for all companies (blue line) is very high.


How high are Q4 2017 revenues expectations? As the right-most blue line in the next chart shows, it now ranks as the highest in the post-crisis era.


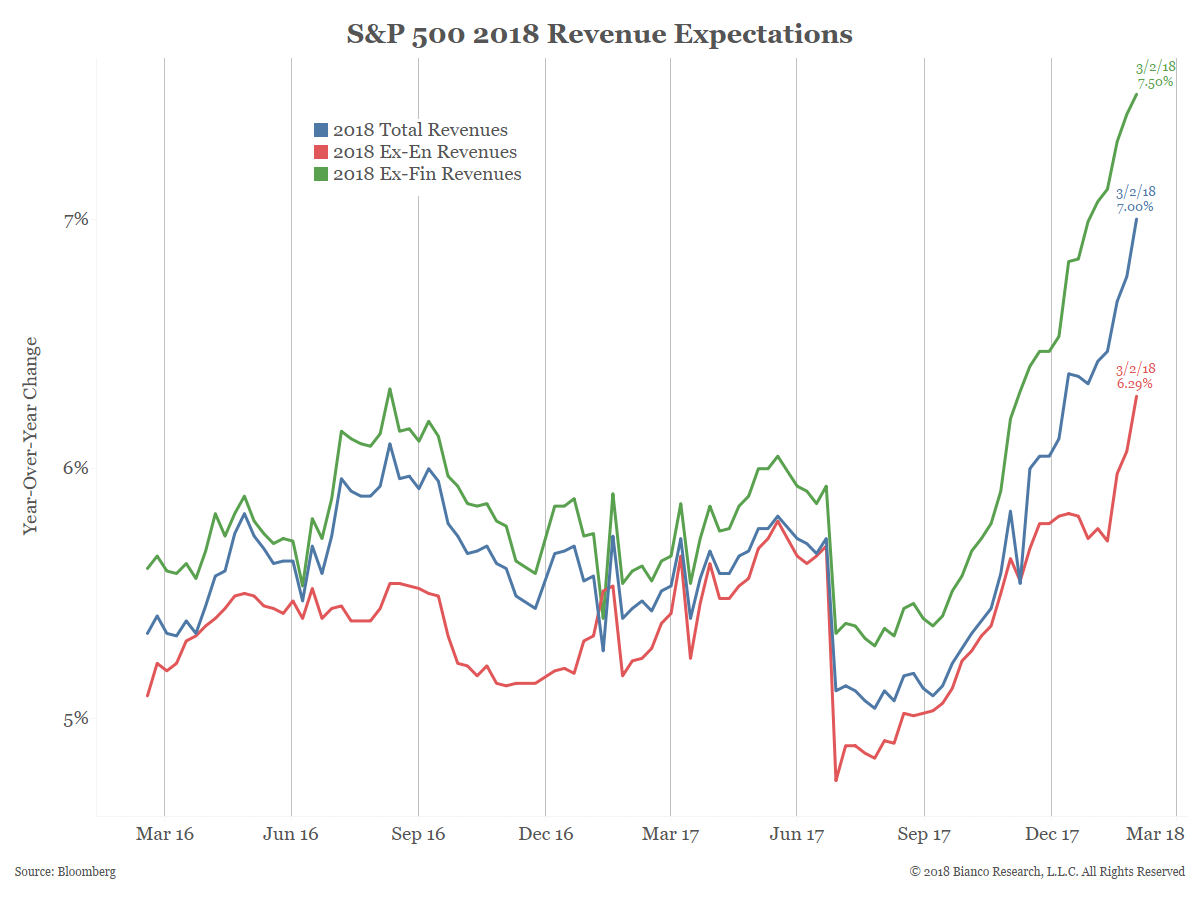
Full-year 2018 revenue forecasts are also going vertical and stand at 7.00% (blue line).


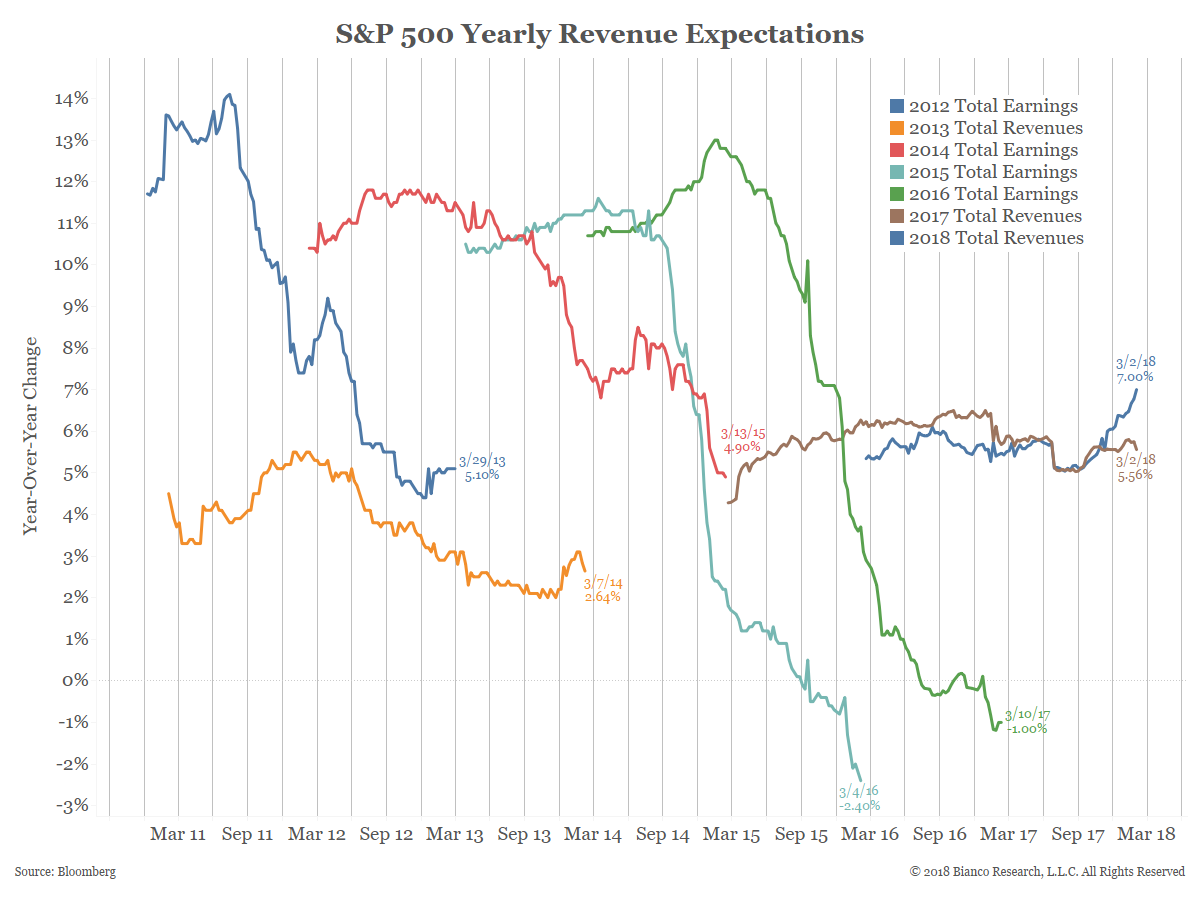
As the right-most blue line in the chart below shows, 2018 revenue expectations are the highest in the post-crisis period.

Earnings are being driven by an expectation of a surge in revenues as much they are by the new tax code.
REQUEST A FREE TRIAL