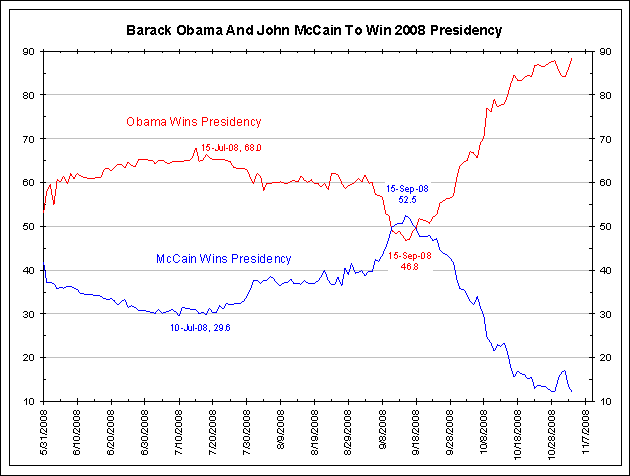
<Click on chart for larger image>
Comment We view Intrade.com’s election betting as a real-time poll. If there is any movement toward a McCain surprise, expect InTrade to react immediately. You can track Intrade in the column to the right. The blue boards update every 30 seconds. By clicking on any of the markets, you can get more information, charts and data.
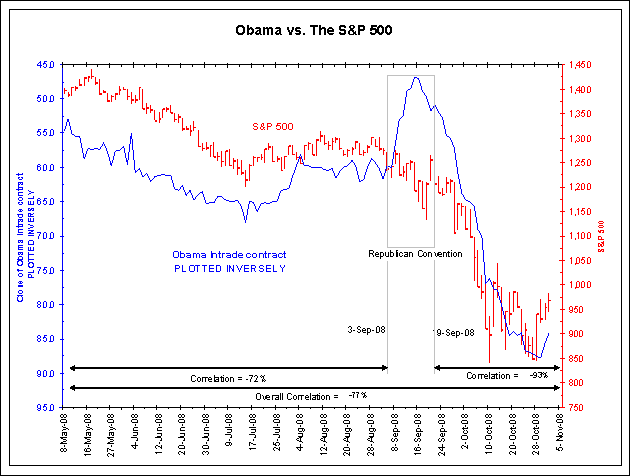
For those that think an Obama victory is bad for the markets, we offer the following chart. Please note that this measure will not pass any statistical tests. We offer it for grins and discussion.

<Click on chart for larger image>
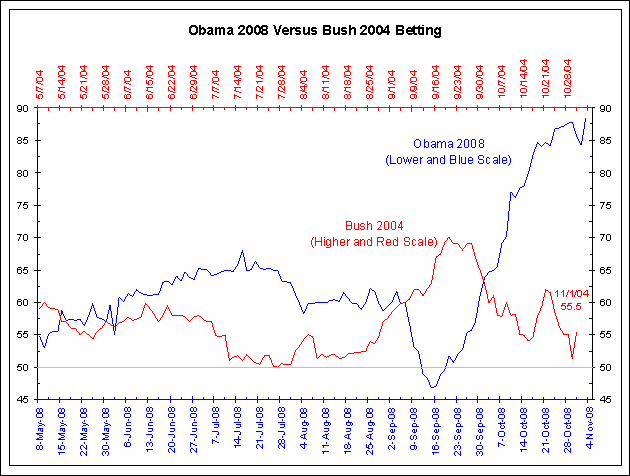
Finally, let’s compare the 2004 betting to the current betting. The red line below shows Bush’s odds of winning in 2004. The betting was 55.5% on election eve. Contrast this to Obama’s odds (blue line) which stand at 88% on election eve.
Bush’s margin of victory was 2.4% (50.7% to 48.3% for John Kerry), carrying 31 states with 286 electoral votes. Kerry carried 19 states plus DC with 251 electoral votes. More on the 2004 election results can be found here.
Regarding the final 2004 polls, 13 polls were taken the weekend before the election. Kerry led in two polls (Fox news and Marist) and two others had a tie (Gallup and ARG). The closest poll was TIPP predicting a 2.1% Bush win.
The current polls have Obama leading by an average of 7%. They vary from a low of 2% (IBD/TIPP, the closest in 2004) to 13% for CBS News.
Finally, Since October 1, there have been 260 polls, almost 10 per day! This is more than all of 2004. So yes, we have been “over-polled” this election year.
