Summary
Comment
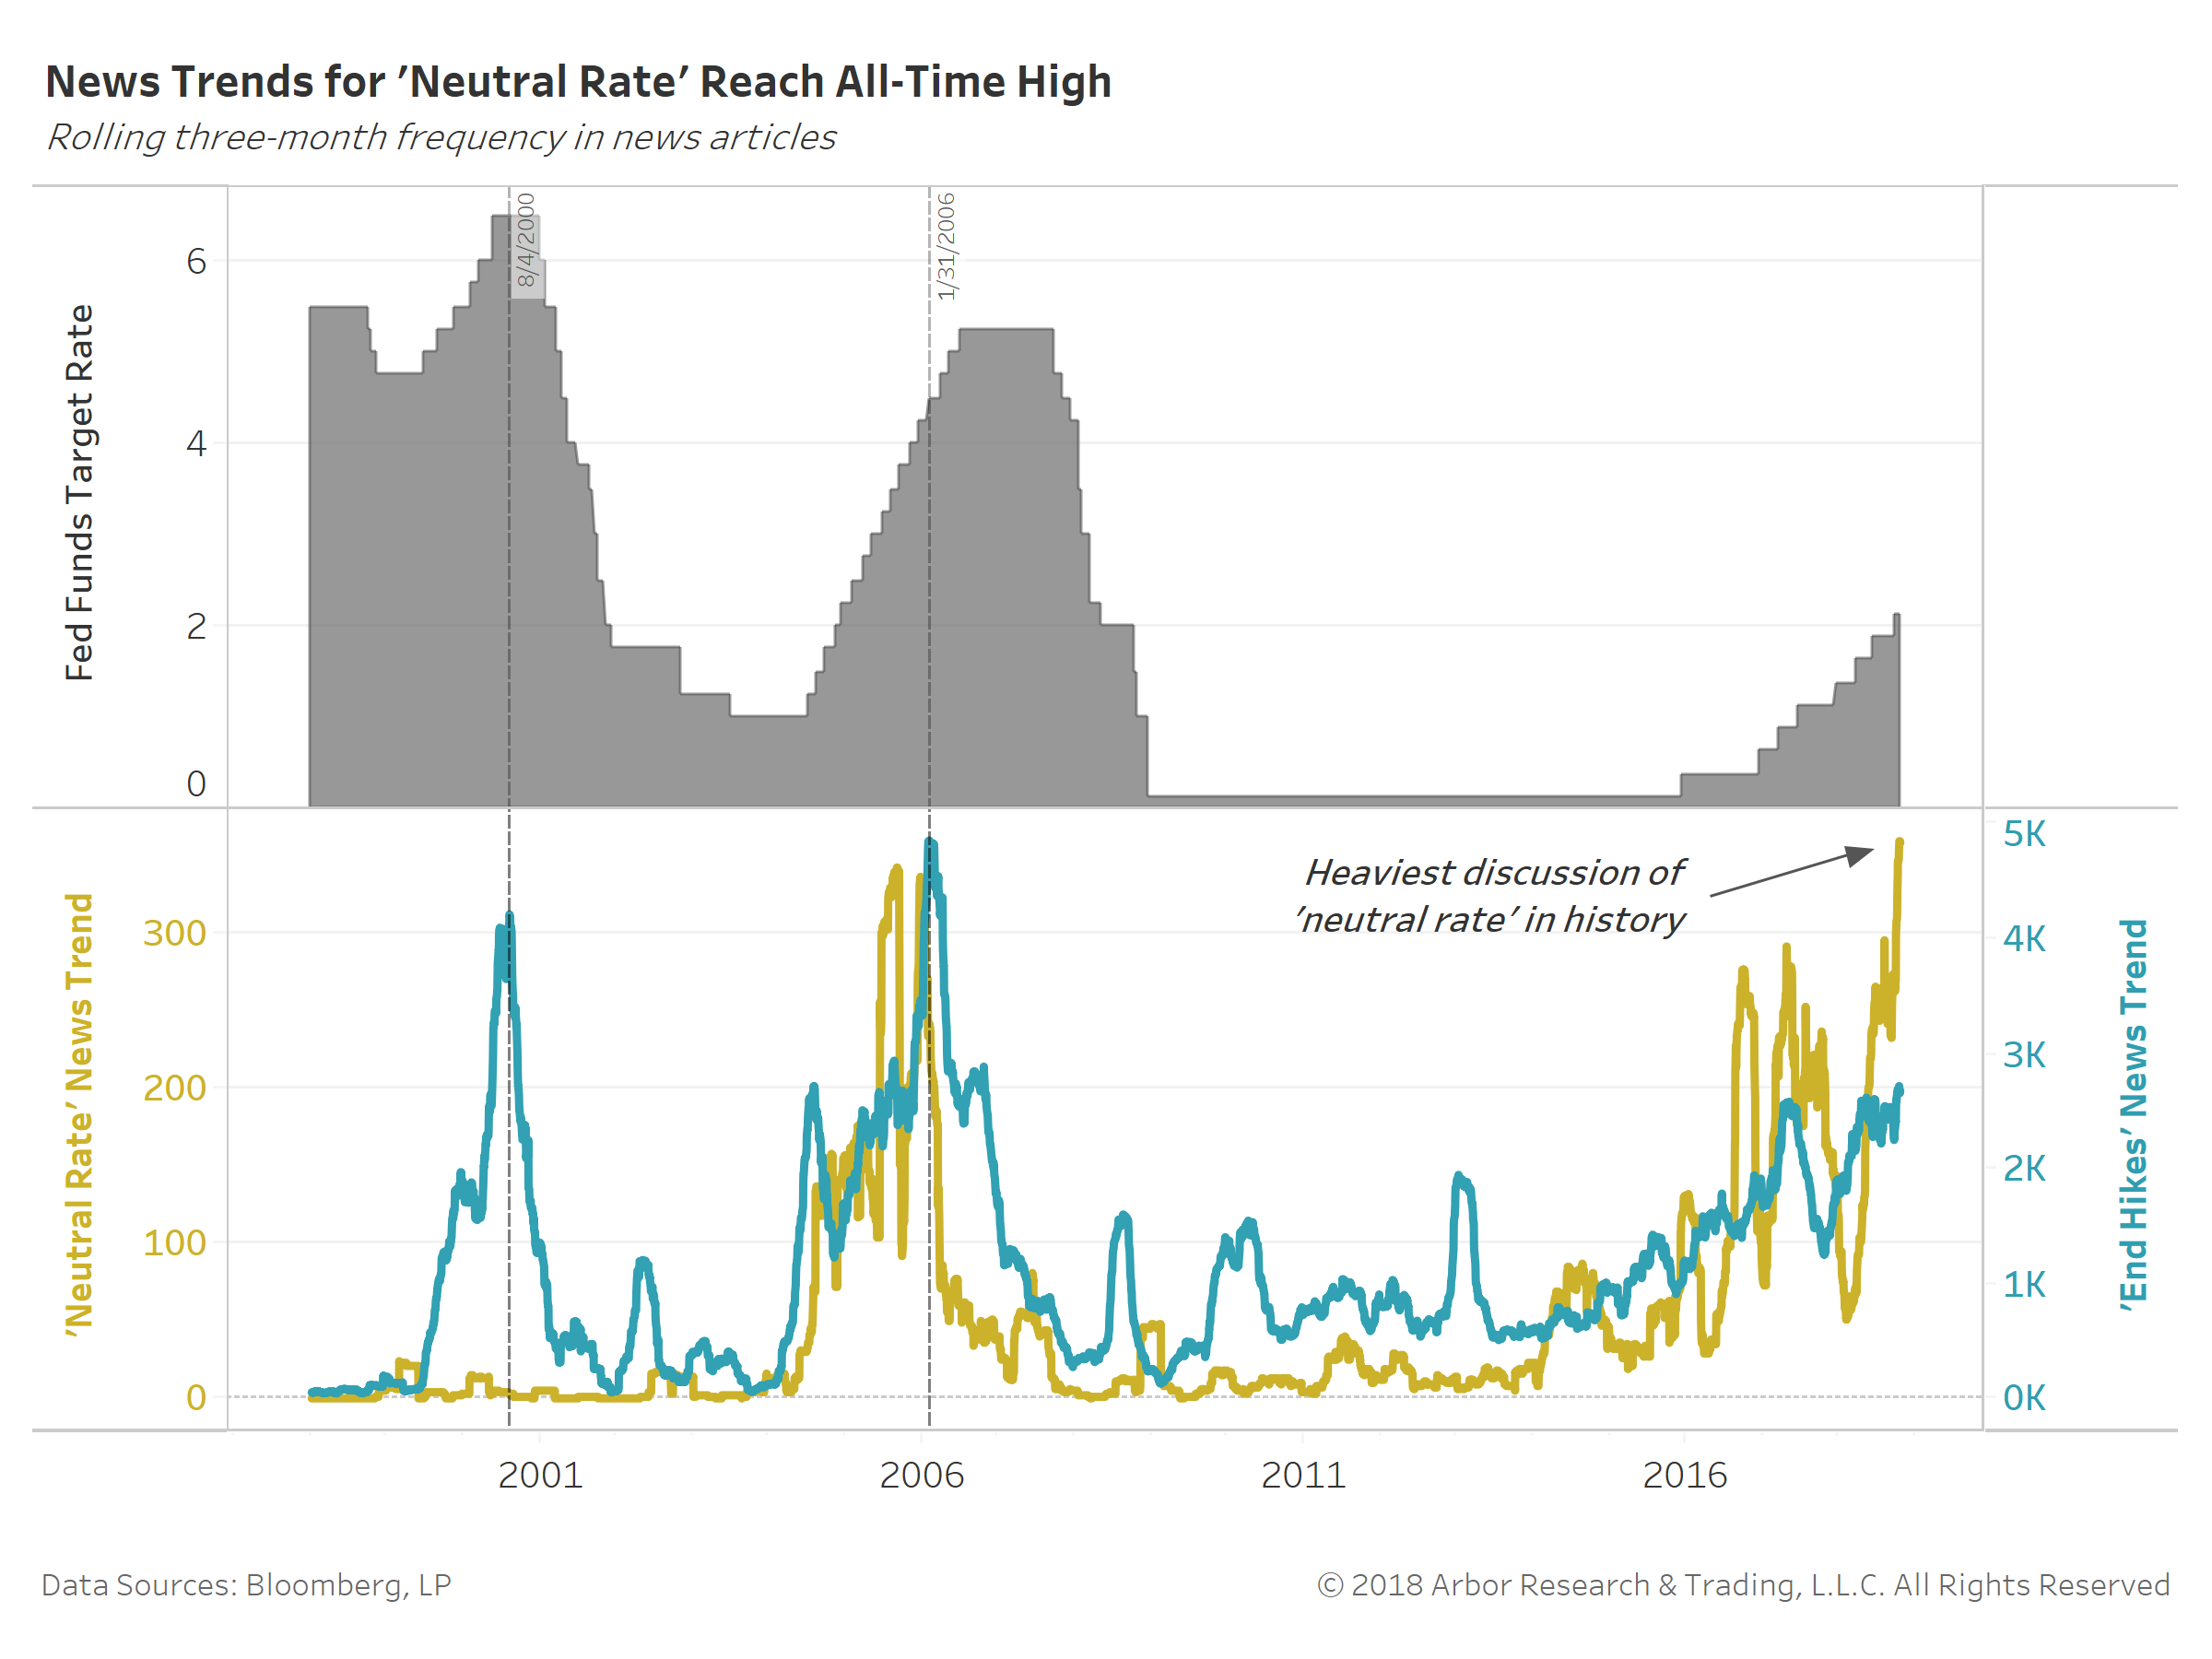
News trends for the ‘neutral rate’ have reached an all-time high, surpassing frequencies seen in late 2005 and early 2006. Discussions of ending tightening have just recently broken out to the upside, but have yet to reach levels historically synonymous with an impending end to rate hike cycles.
The clincher for financial markets is no longer the likely December 2018 hike, but how many additional hikes will take place in 2019.
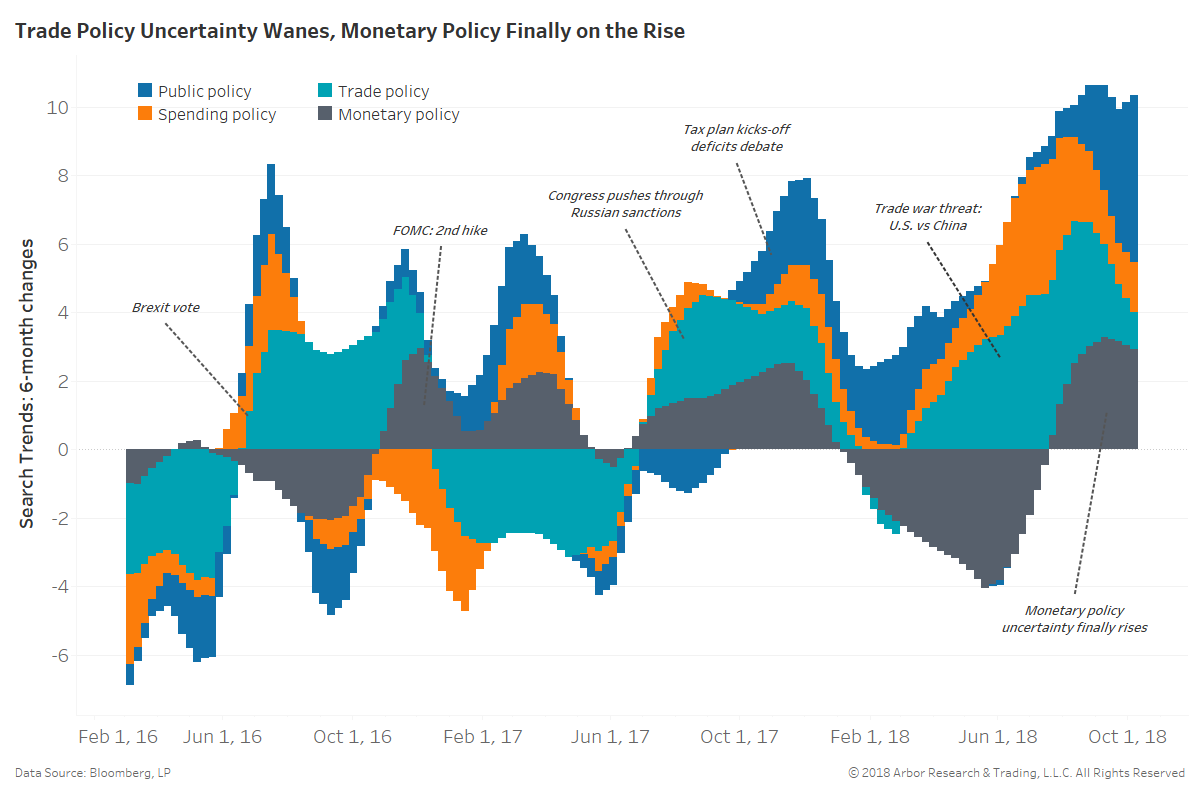
The chart below shows rolling six-month changes in Google searches for public policy, spending policy, trade policy, and monetary policy. Consumer interest in trade policy (light blue) has appreciably declined in recent weeks, while concern about monetary policy (dark gray) is near the highest during this tightening cycle.
A large disconnect continues between market-based and Federal Reserve expectations for hikes in the months ahead. Fed rhetoric suggests five hikes versus the market’s 2.7 hikes. Investors are digging their heels in over inflation being unable to run above the Fed’s target for the years to come.
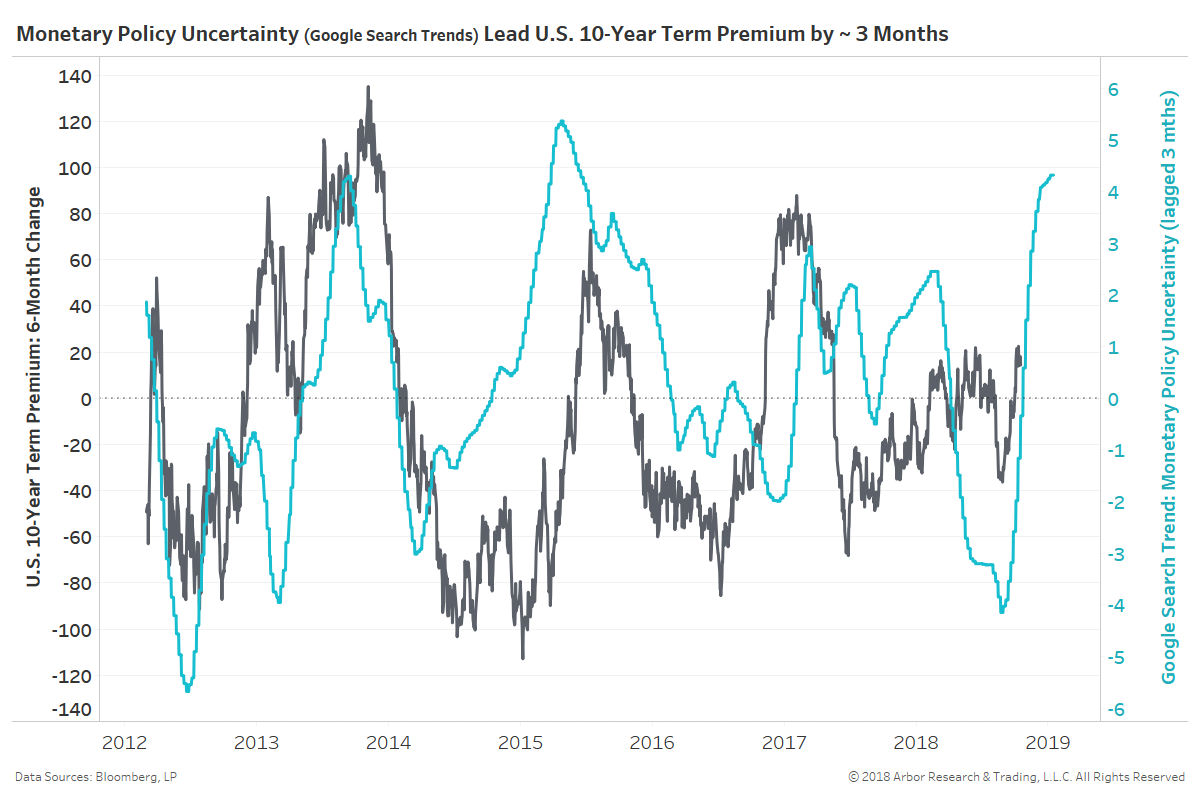
The next chart shows the six-month change in U.S. 10-year term premium (black, left axis) along with the Google search trend for monetary policy lagged three months (blue, right axis).
Higher uncertainty over the path of interest rates and economic growth have tended to give rise to term premium. The current condition suggests term premium has the potential to break free from its longest 50 bps trading range in history, reaching 400 trading days.
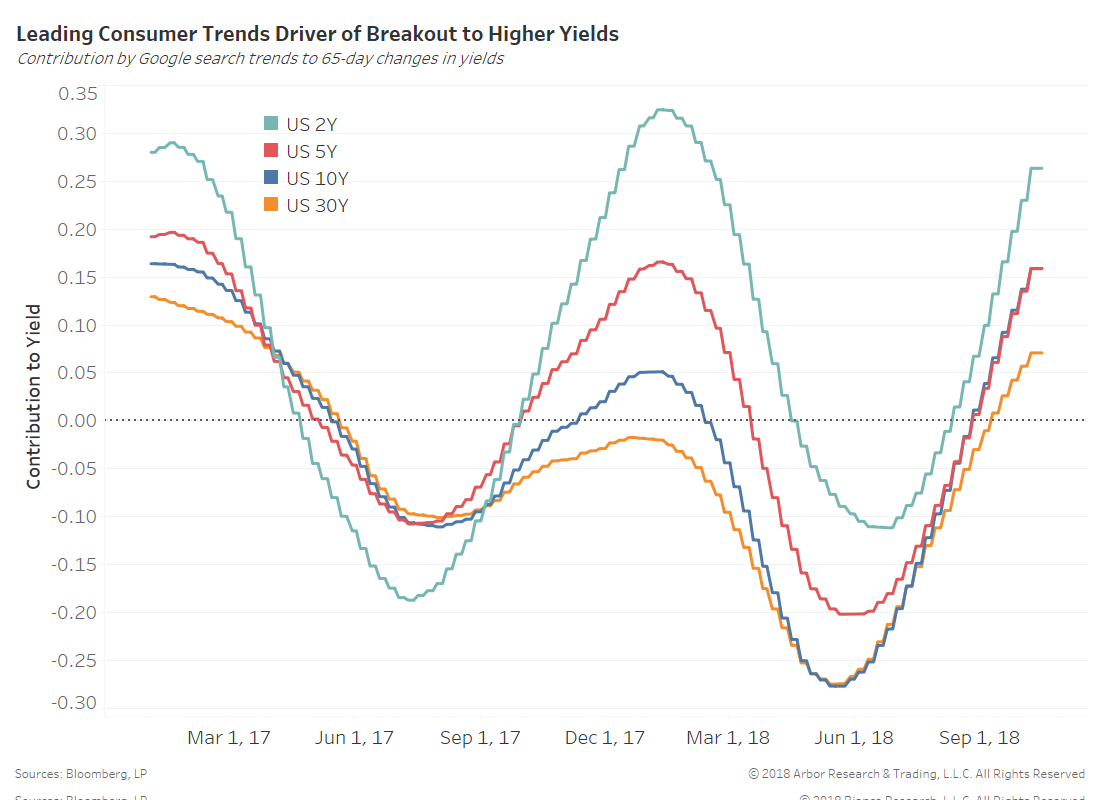
Favorable consumer trends, in other words real growth expectations, have helped drive U.S. Treasury yields higher. The chart below shows the contribution by Google search trends, which are a leading indicator of economic activity, to three-month changes in yields.
The wave of increased potential for consumer spending and more beginning in October 2017 fueled the ascent by yields to start 2018. A similar wave began in late August 2018. We attribute approximately 16 bps of the U.S. 10-year note yield’s recent rise to these favorable consumer trends.
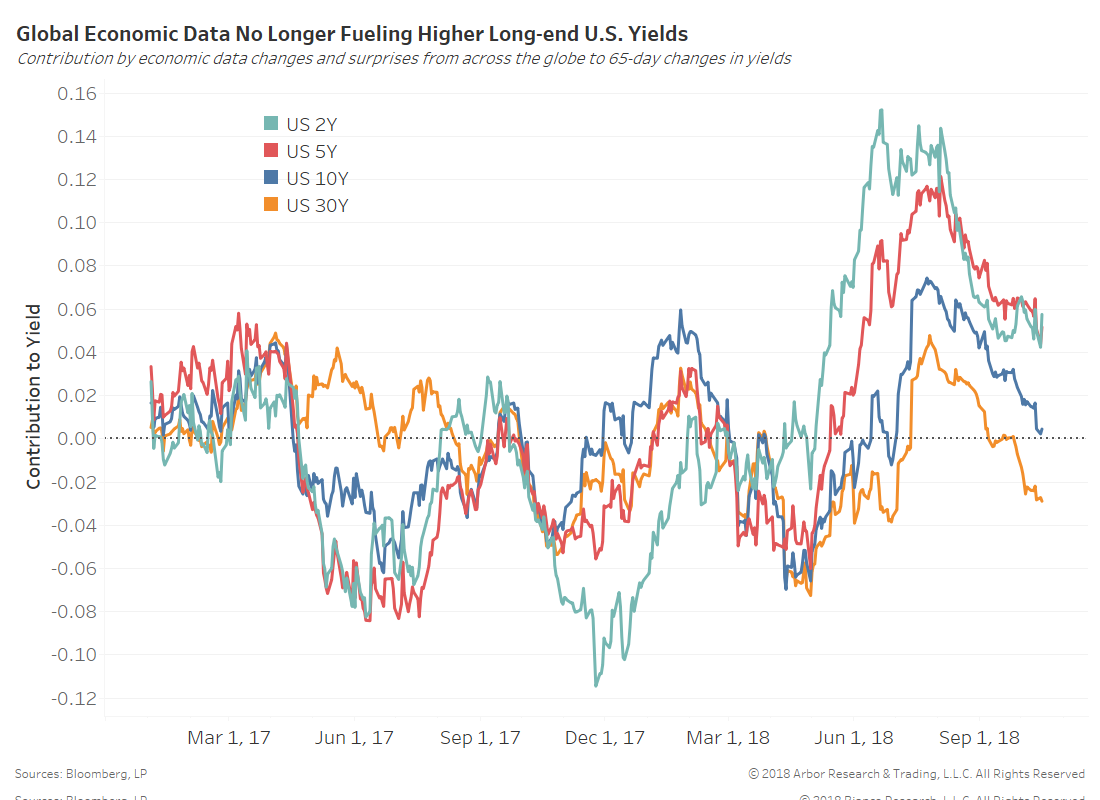
On the flip side, realized economic data from across the globe have slowed into the fall of 2018. The last chart shows the contribution by economic data changes and surprises from 35 developed and emerging economies to three-month changes in yields.
A continued slowdown to below-average growth rates would favor lower long-end yields. We will be closely watching Citigroup Economic Data Change indices for the weeks to come.
Bottom Line
Long-end U.S. Treasuries should see higher term premiums as monetary policy uncertainty brews. But, a continued march higher in yields requires favorable consumer trends to fuel growth and finally cause a breakout in sluggish inflation expectations.