>85% of the roughly $30B net monthly flows to 401Ks are simply going to Target Date Funds. There is no “allocation” mechanism other than “how old are you?” https://t.co/TAvp4nhUug
— Michael Green (@profplum99) June 25, 2022
How Popular Are These Funds?
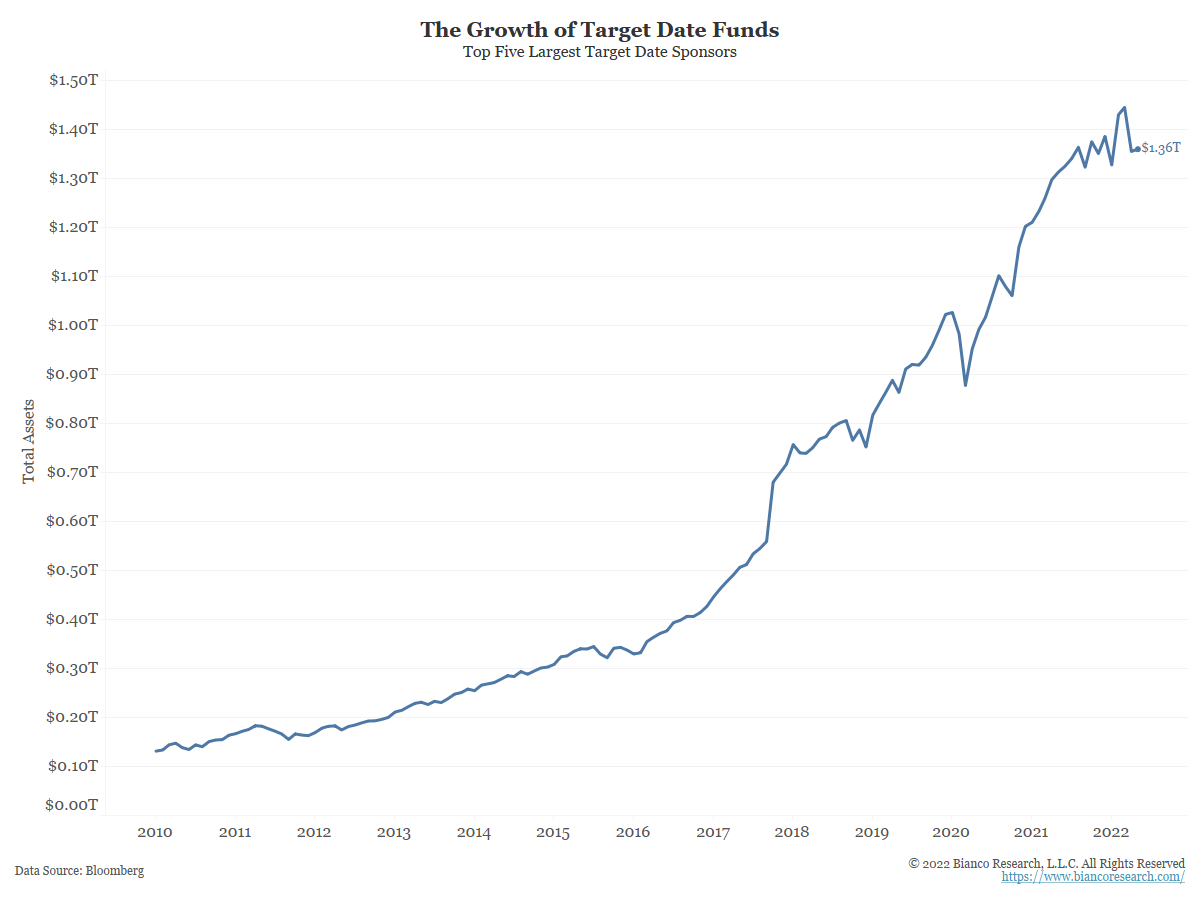
As Michael Green noted above, over 85% of inflows into 401K retirement accounts are heading into target-date funds. The chart below shows the assets of the five largest sponsors of target-date mutual funds, Vanguard, Fidelity, American Funds, BlackRock, and State Street. In 2010, these five issuers had a combined $103 billion of assets in target-date mutual funds. In May of 2022, that figure ballooned to $1.36 trillion.
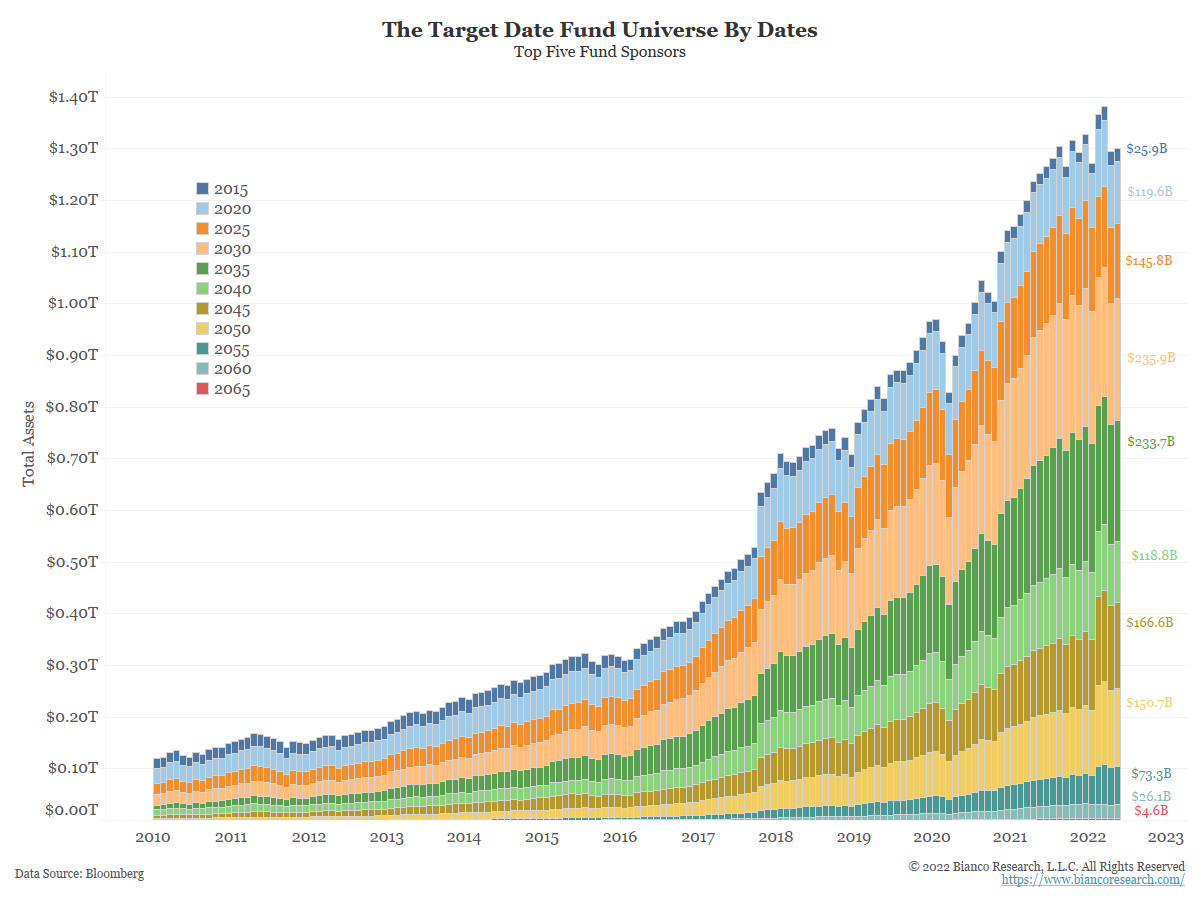
The next chart breaks down the assets of these target-date funds by their targeted retirement year. Note that funds with closer retirement dates have a larger amount of assets as investors have contributed more over time.
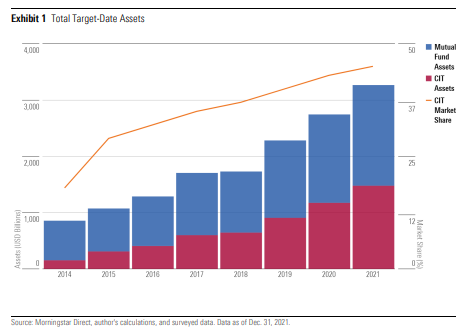
Morningstar publishes a report detailing the target date universe. The most recent report states that total assets have surpassed $3.2 trillion (the charts above only detail the biggest target date mutual funds, but exclude collective investment trusts). According to the report, CITs accounted for nearly 86% of target-date inflows in 2021 and are likely to surpass mutual fund inflows in the near future.
Target Date Funds Are Similar to Allocator ETF’s
The idea behind target-date funds is that investors can “set it and forget it.” As such, they are typically offered by human resource departments where employees check the box for the fund that corresponds to their expected retirement date. Money is deducted from their paycheck and invested in their funds at regular intervals.
These flows into target-date funds are similar to the Bloomberg ETF allocator funds which are shown below. Allocators are ETF fund flows into ‘buy-and-hold’ strategy funds versus actively traded funds. Allocator ETFs are used by investors who simply want to buy stocks for the long term.
The chart below shows the flows into allocator funds (blue) are steady and seemingly immune to market fluctuations. The flows did not change during the 35% decline in the markets during the pandemic lockdowns in 2020 and are not showing any weakening as the current market has sunk into bear market territory. By contrast, trader ETFs (orange) do fluctuate with the ups and downs of the market.
.png)
Money continues to move into “buy-and-hold” passive ETF vehicles in much the same way they are moving into target-date funds.
Market Effects
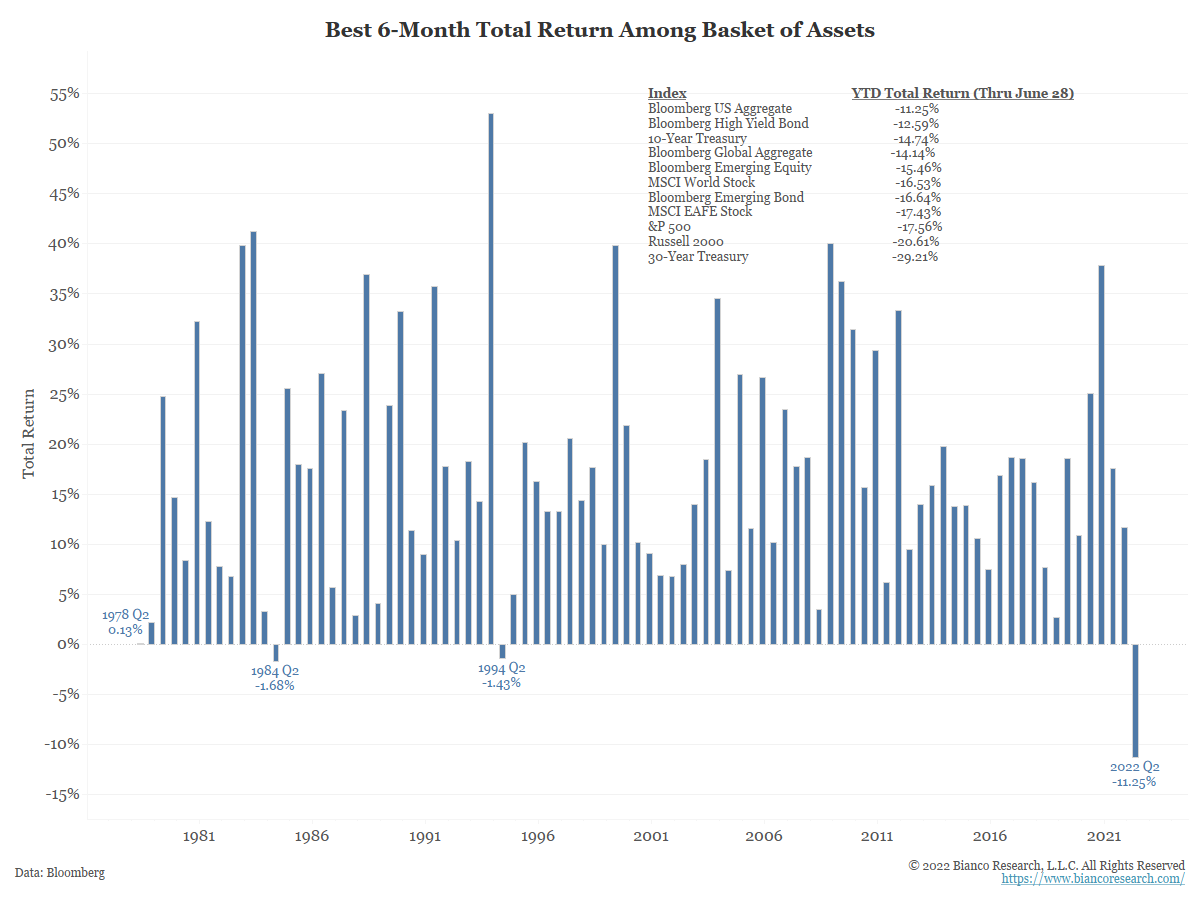
Inflows into allocator and target date funds continue despite the poor performance in the first six months of the year. The chart below shows the best performing financial asset class is down over 11% in 2022, a rare negative bar. But because investors are passively setting money aside each month, inflows into target date funds and allocators continue.
These consistent and constant inflows have the potential to move markets, especially around the end/beginnings of months when these funds typically rebalance.
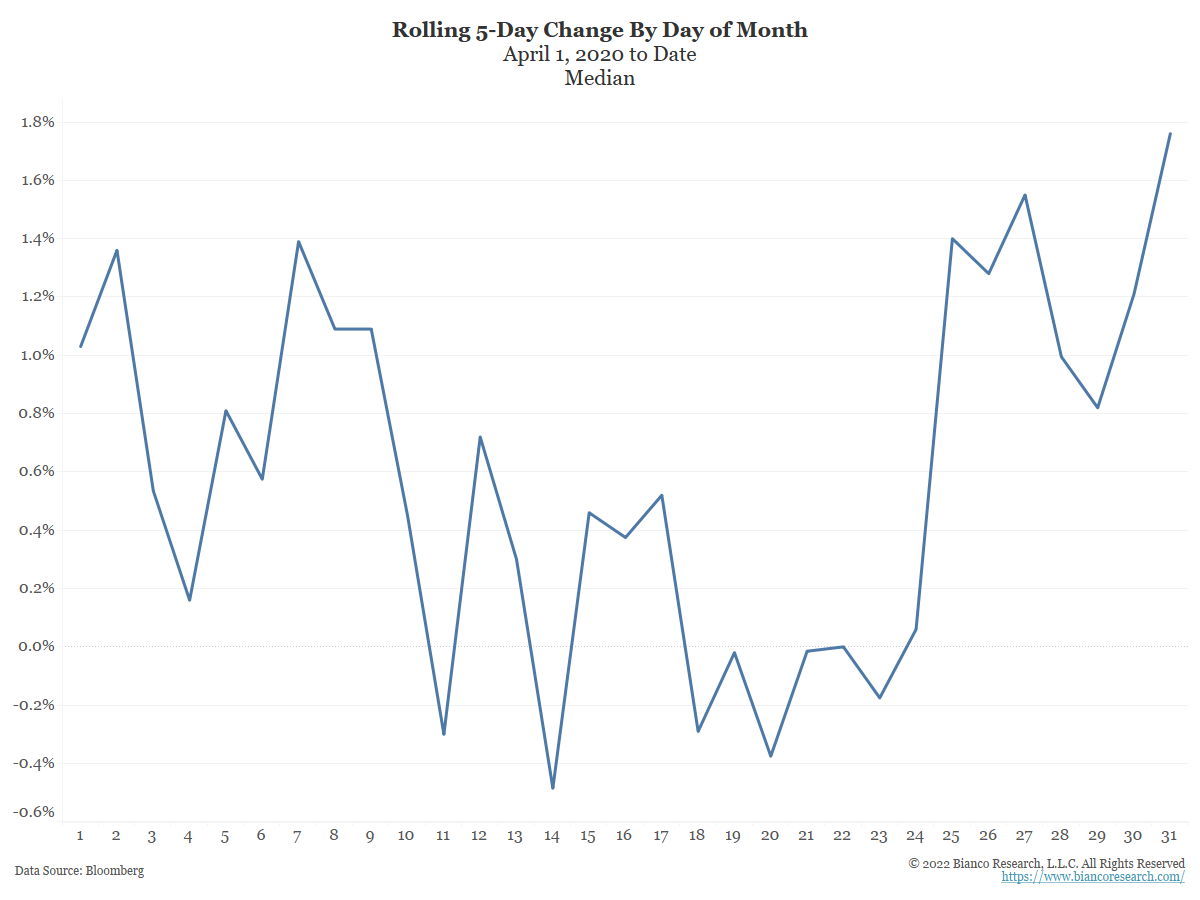
The next chart below shows the rolling 5-day change of the S&P 500. It is clear that as the month comes to a close and these funds reallocate capital, the index tends to rise into month-end.
According to a recent MIT study:
Target date funds have “quantitatively large effects” on inflows and outflows from the mutual funds they buy and sell, which in turn is having some effect on the prices of the stocks these mutual funds hold.
Simply put, money is withdrawn from employees’ accounts and invested in their target-date fund. Rebalancing of these funds tends to create equity buying pressure, as funds typically have to be reallocated away from bonds and into stocks to get back to their preferred equity weighting. In recent years these operations are performed monthly around the end of the month.
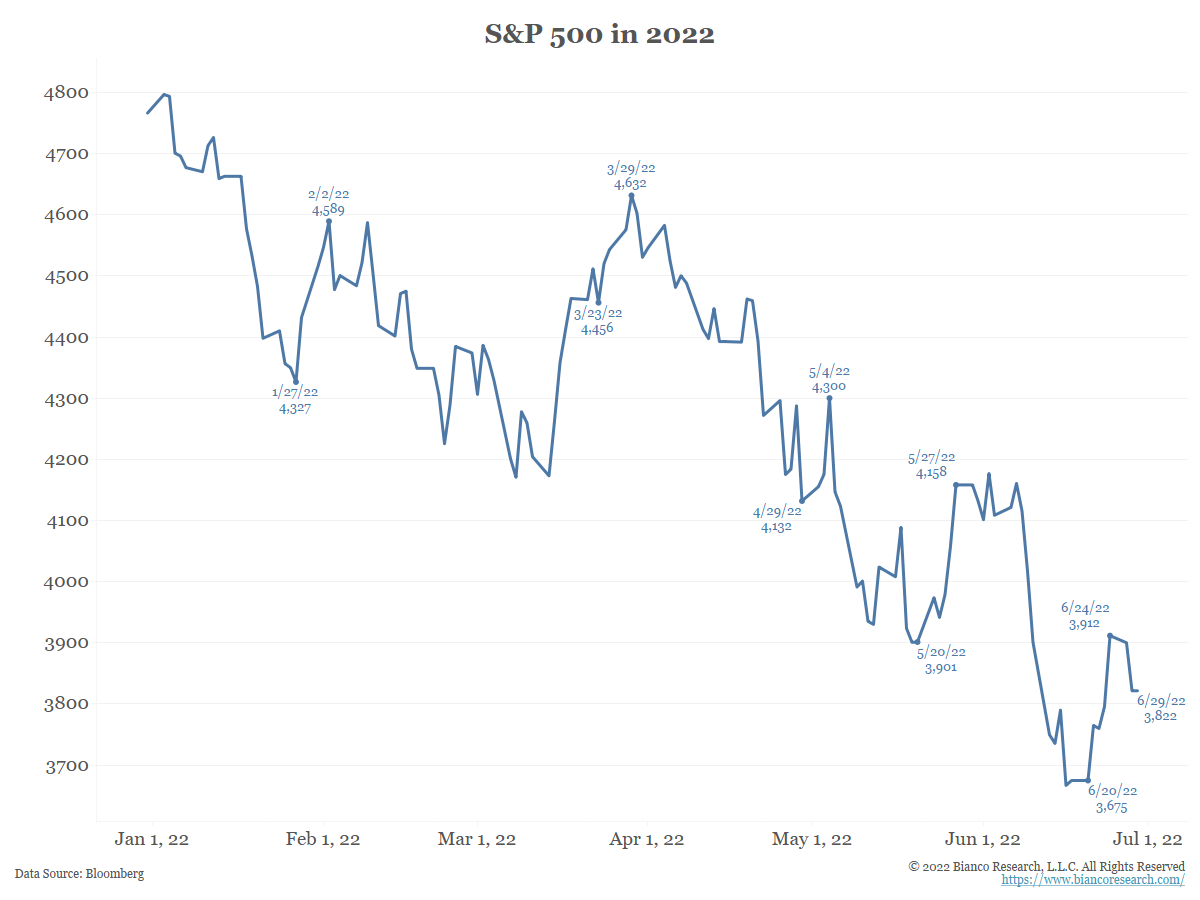
This pattern has been very evident as the market has struggled in 2022. The chart below highlights the dates around the last week of each month this year. It is fairly common to see a rally during these periods.
Conclusion
Target date funds offer a simple way to save for retirement. Contributions are often systematic and have grown substantially over the past decade. They continue to see asset growth even during bear markets. These systematic inflows could be contributing to the pattern of rallies at end-of-month rebalancing.
Summary
Target date retirement funds have grown from less than $10 billion to almost $4 trillion in little over a decade. Their actions are having an effect on markets.
Understanding Target Date Funds
Target date funds are structured to grow assets in a specified time frame, usually to retirement. The funds are typically offered in five-year buckets (i.e., 2025, 2030, 2035, out to 2065) and participants should pick the fund that corresponds to the year they expect to retire.
These are often structured as a ‘fund of funds’ in which the target date fund owns other passive funds rather than individual securities, thus are passive vehicles for retirement investing. They come in one of two types: a mutual fund or a collective investment trust (CIT). CITs pool assets from contributors into a single diversified portfolio.
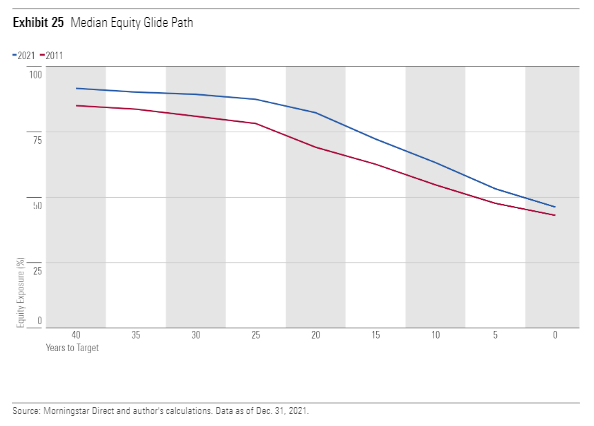
An important note is the rebalancing feature of these funds. As you age, the allocation within the fund shifts to a more conservative investment strategy (fewer equities, more bonds). This is referred to as the glide path.
The Morningstar chart below shows a median equity percentage glide path for all target-date funds. Note the current glide path (blue) is significantly more exposed to stocks than target date funds from 10 years ago (red).