Summary
Comment
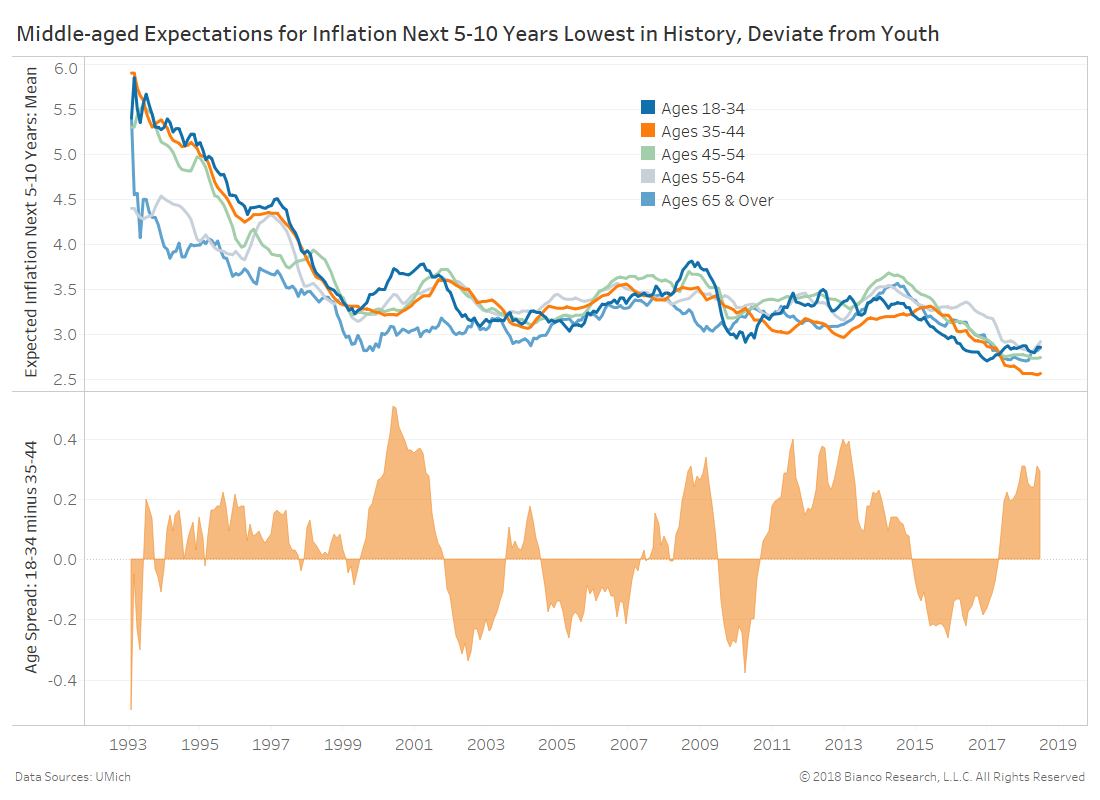
The most recent University of Michigan consumer sentiment report shows a persisting gap in inflation expectations between younger adults aged 18 to 34 versus middle-aged people from 35 to 44.
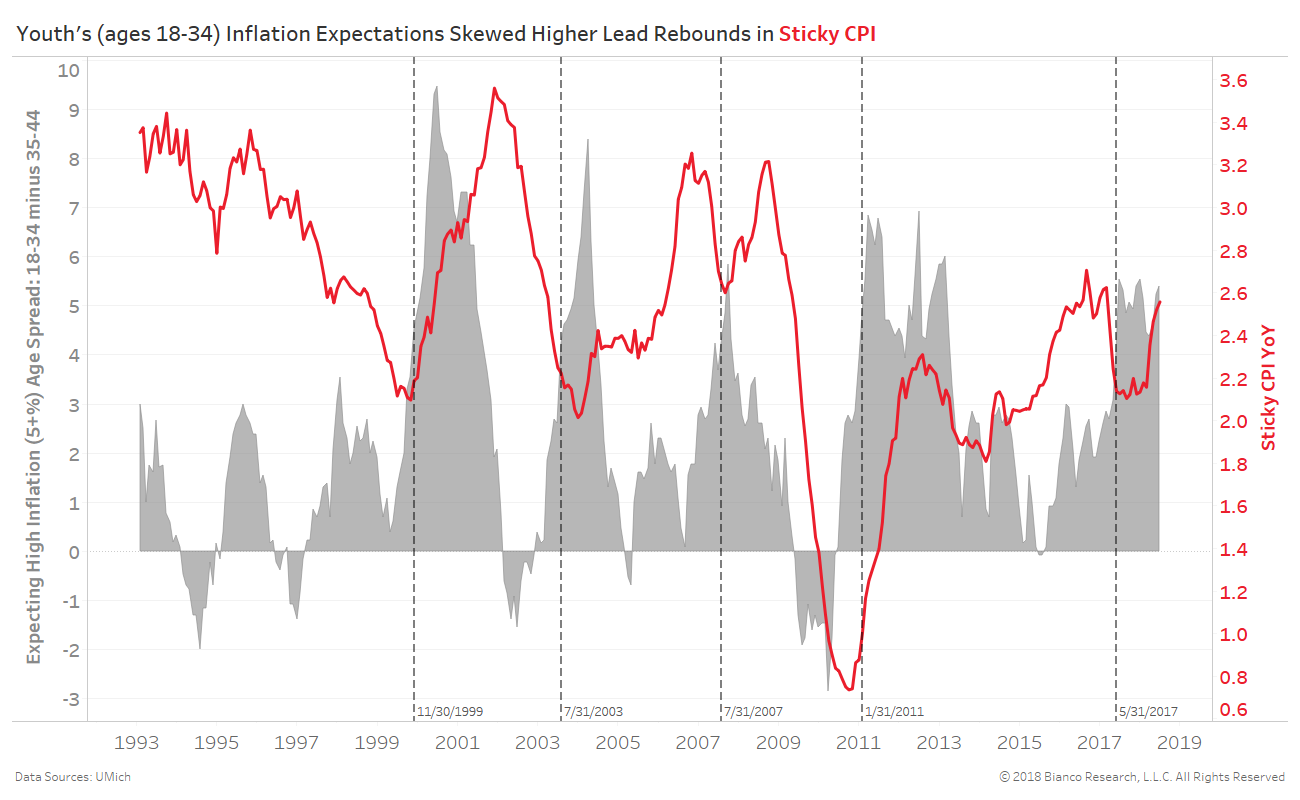
The chart below shows the rolling 12-month mean expectation for inflation over the following 5 to 10 years by age group. The bottom panel provides the spread between ages 18 to 34 and 35 to 44 years.
Those aged 35 to 44 years are expecting the lowest rate of inflation in history at 2.6% YoY. On the flip side, the youngest cohort aged 18-34 years have seen modestly rising expectations to 2.9% YoY.
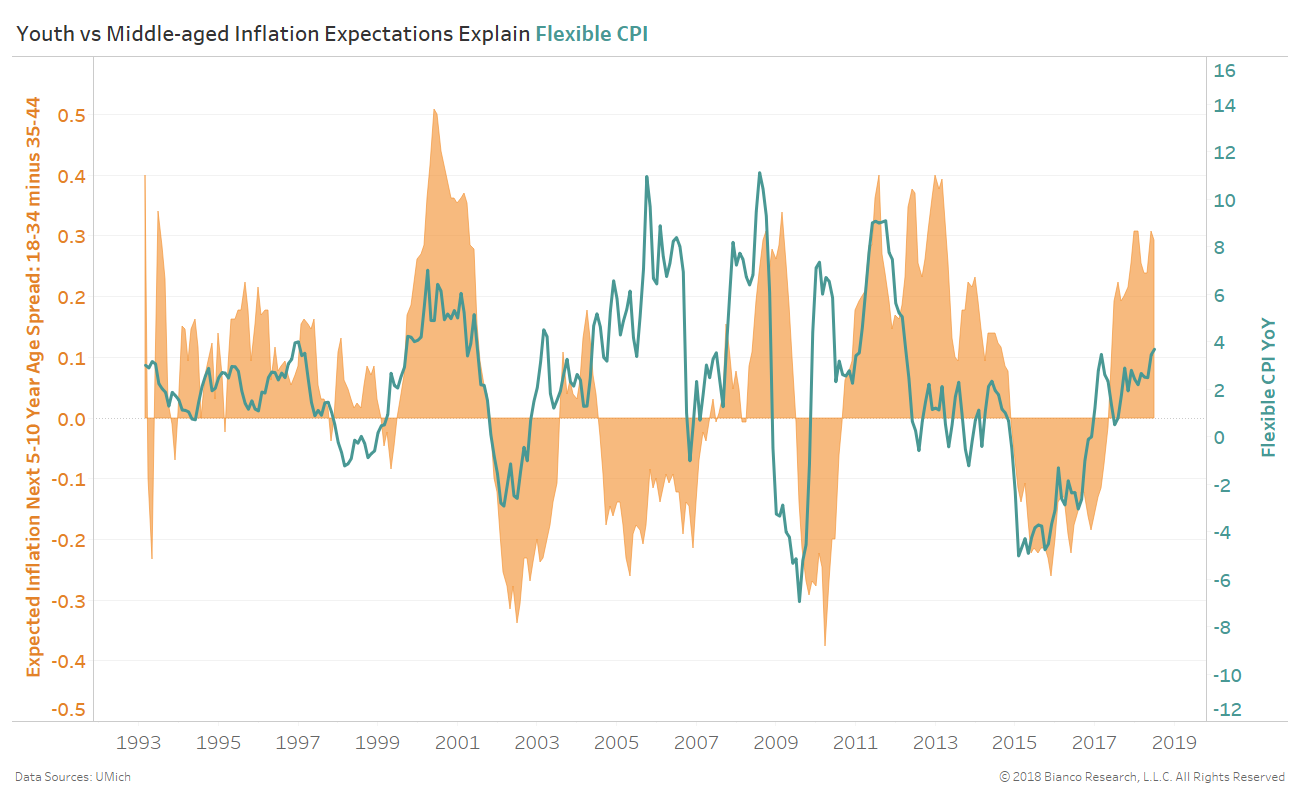
Widening gaps in the expectations for long-run (5-10 year) inflation between ages 18 to 34 and 35 to 44 years track a breakdown of CPI by the Atlanta Fed into “flexible” and “sticky” components in the chart below. The 18 to 34 age group are the most sensitive to shifting flexible prices with lower average discretionary incomes than older working ages.
‘Flexible’ CPI measures the more volatile components quickly adjusting to changing conditions like gasoline prices. Conversely, ‘sticky’ CPI measures the more stable components like administrative fees or laundromat prices.
The rise in flexible CPI is failing to achieve heights we would expect based on its relationship to this gap between young and middle-aged inflation expectations. Additionally, similar extremes in expectations have been short-lived, leading to slowing growth in flexible prices.
What Have We Learned?
Flexible CPI will likely struggle to gain more ground, while sticky CPI trends higher.
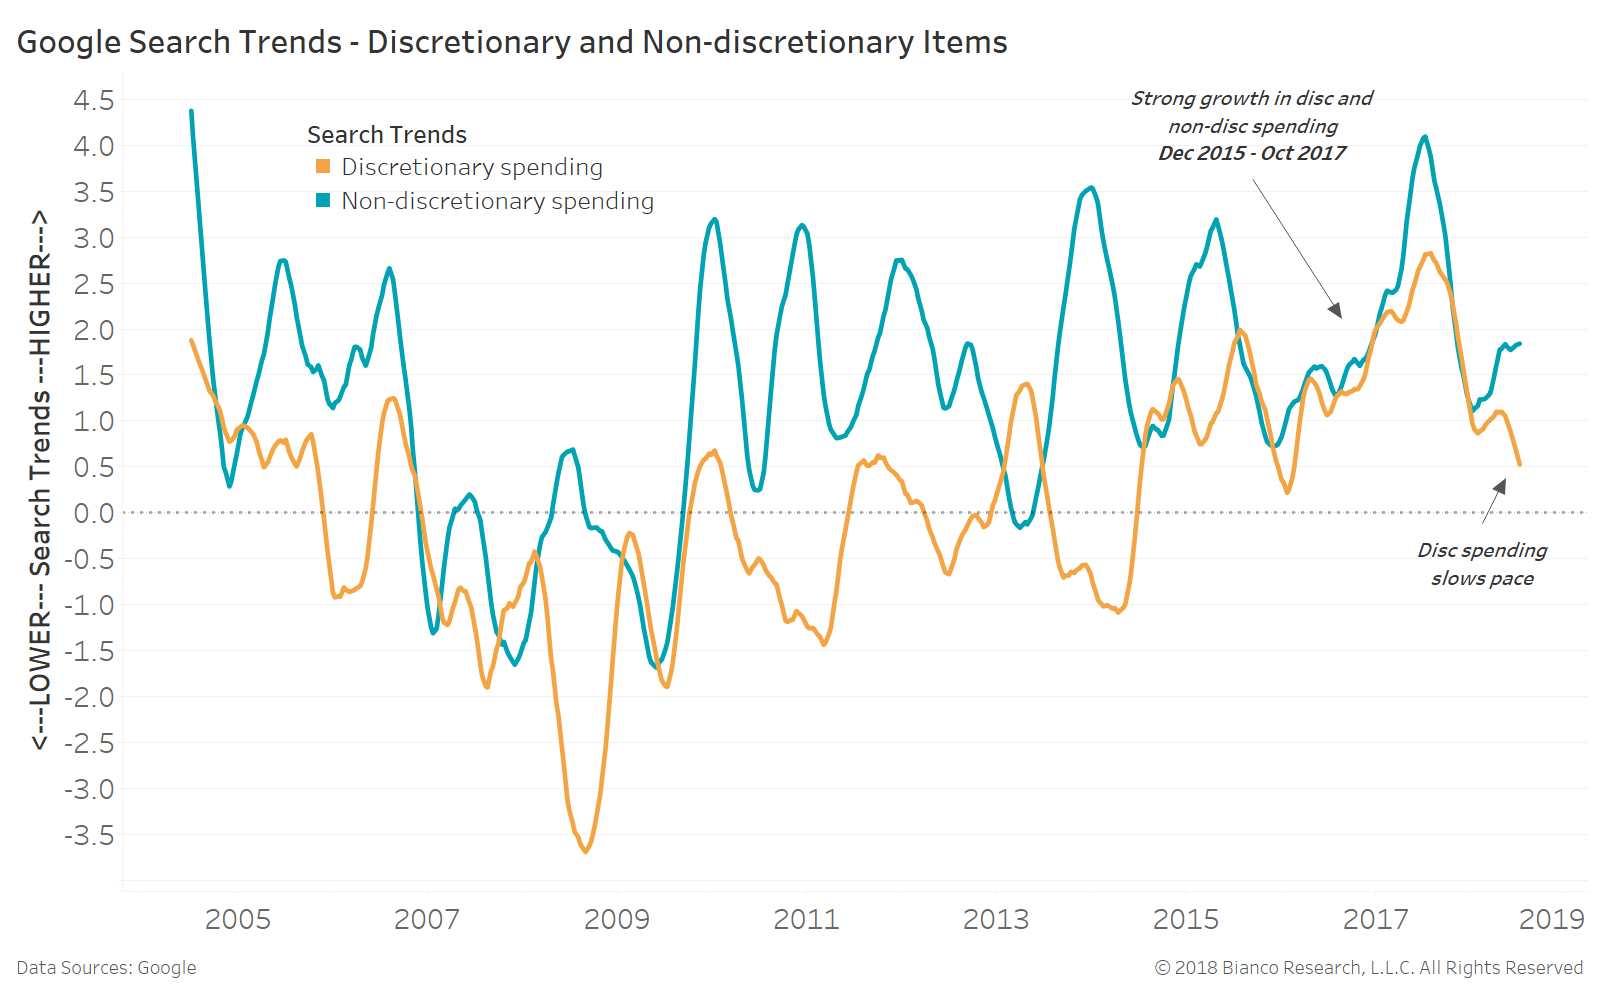
A potentially better measure of consumer expectations than surveys (like shown above) are Google search trends. We gain a more real-time window into a less biased measure of consumer needs, wants, and desires.
The chart below shows six-month changes in trends for discretionary (orange) and non-discretionary (blue) searches. Discretionary includes items like concerts, nightlife, beauty, and fitness. Non-discretionary includes items like apartment rentals and groceries.
Both types of spending grew consistently from December 2015 through October 20117. But, discretionary spending searches have again fallen below non-discretionary in 2018.
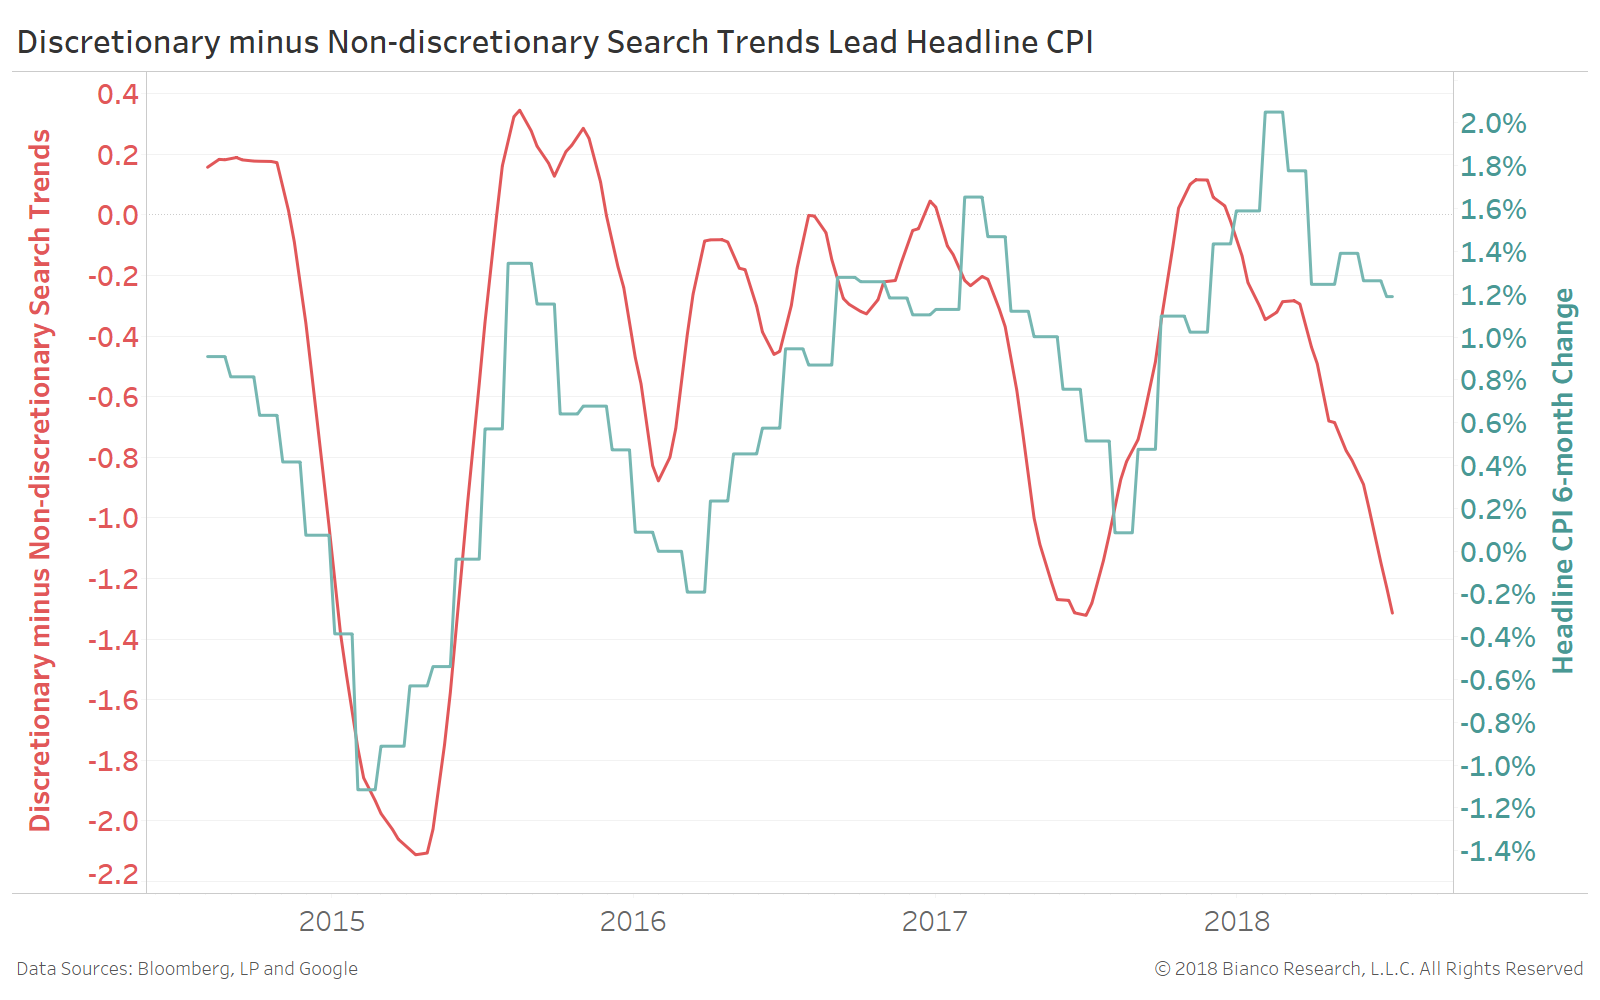
The next chart shows the spread between searches for non-discretionary and discretionary items (red line) along with six-month changes in headline CPI. Search activity tends to lead realized changes in headline CPI.
Falling discretionary spending searches suggests headline CPI will moderate late into summer as flexible components subside. However sticky CPI is poised to remain well above 2.0% given positive search activity across all items.
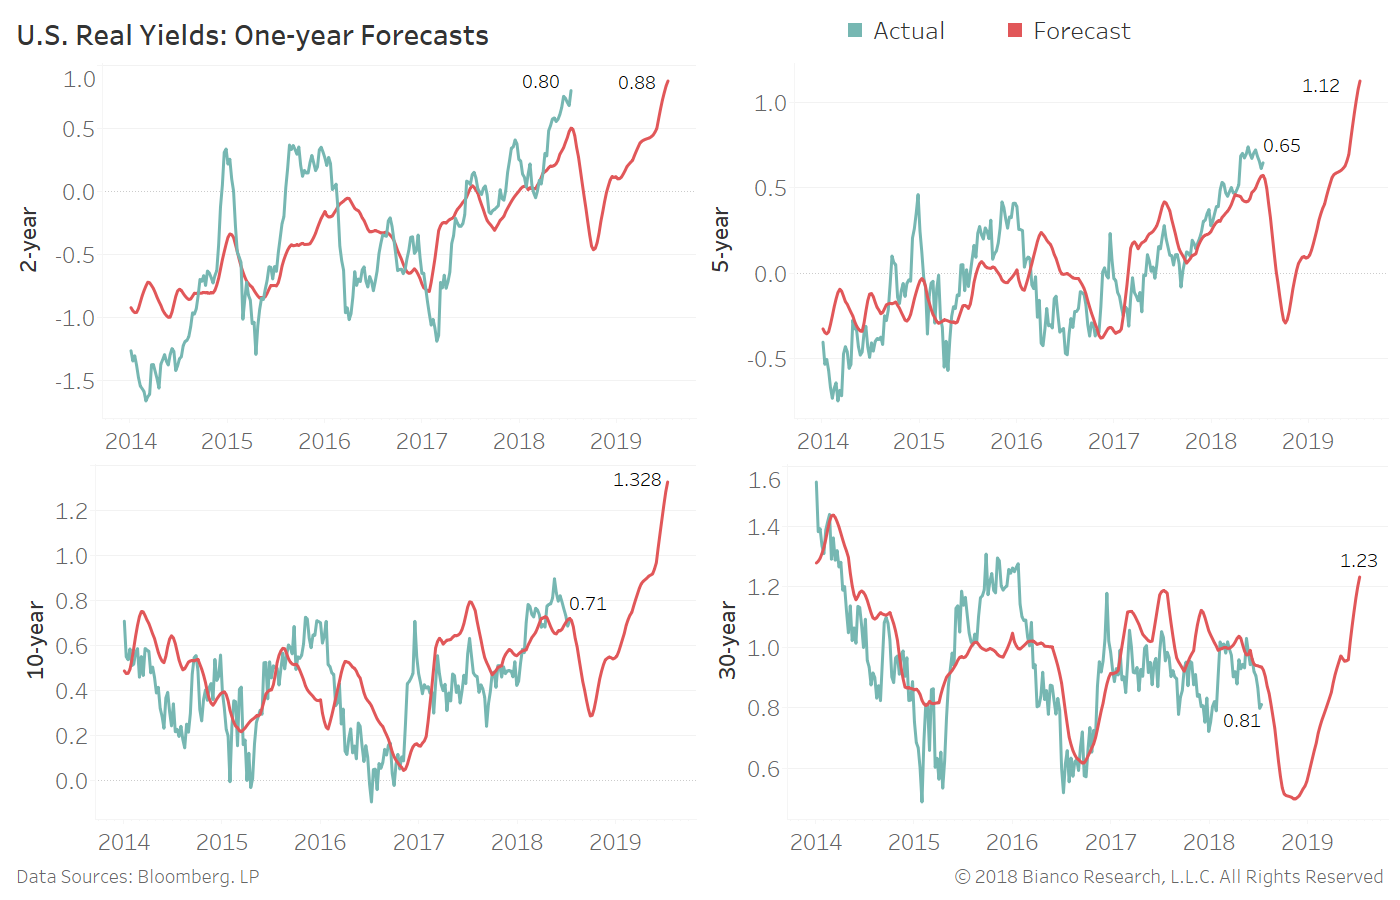
The last chart shows one-year forecasts for U.S. real yields (TIPS) using:
- discretionary search trends
- non-discretionary search trends
- flexible CPI
- sticky CPI
- U.S. economic data changes
- FOMC rate hike timing
Forecasts for real yields through July 2019 are rebounding with the tailwind of rising sticky CPI, above-average economic data changes, and elevated rate hike timing.
U.S. 10-year real yields are primed to rise most from 0.71% to 1.33%, while 2-years remain stable near 88 bps. Remember 10-year real yields have dropped 72% and 67% of July and Augusts, respectively. An opportunity should present itself late in the summer for those selling TIPS.