- CNN/Money – Consumer confidence soars under Trump. Here’s what it means
It’s also worth pointing out that the Conference Board’s consumer confidence index surged right after last November’s election as well — to the highest level since July 2007. The Great Recession began in December of that year and lasted until June 2009. All of this is not to say that the economy is about to enter another downturn just because the notoriously late to the party consumer is suddenly feeling giddy. It’s understandable why there is suddenly more hope on Main Street these days. While the Conference Board didn’t mention President Trump by name, it would appear that average Americans — much like small business owners and CEOs — are excited about the possibility of tax reform and stimulus.
Comment
Surveys of economic confidence ranging from consumers to small business to manufacturing are soaring to some of their best levels in a decade. We recently highlighted U.S. equities correlate moreso to these soft data measures than hard data like payrolls and industrial production (see here).
If Sesame Street were to review soft and hard data measures, they would sing a song of consumer and business sentiment “not looking like one of the others.” Hard data growth remains tepid and President approval ratings are sinking.
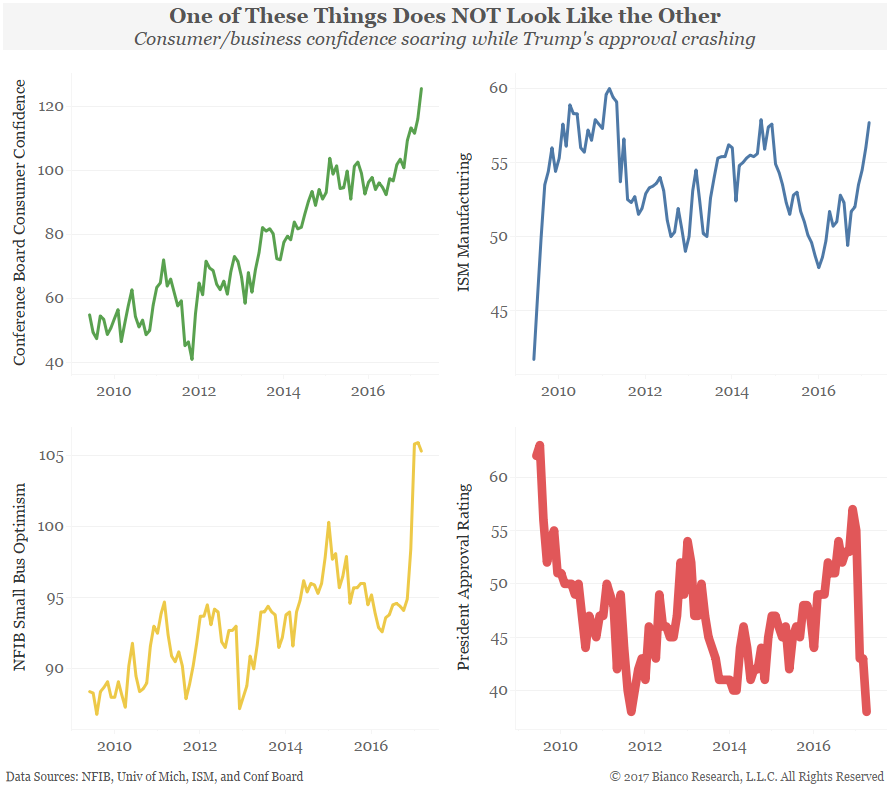
The interactive scatterplot below compares a composite of major consumer/business confidence surveys to Presidential approval ratings since 1953. Trump’s approval ratings (large red circles below) stand out as some of the worst given such positive consumer and business confidence.
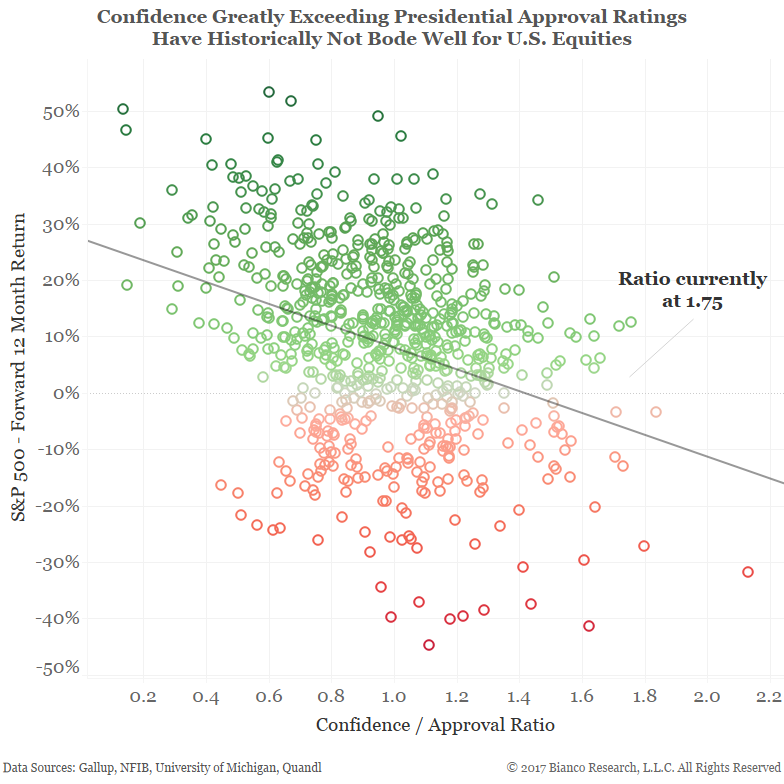
The ratio between these two measures shown in the interactive chart below indicates just how ‘out of whack’ their relationship has become. Trump’s deviation from confidence is only rivaled by instances concerning the Vietnam War, Iraq War, and Watergate. And all these instances were also consistent with equity bear markets and recessions.
The scatterplot below shows the ratio between confidence and Presidential approval ratings from above versus returns 12-months forward by the S&P 500. Excessively higher confidence relative to Presidential approval ratings have often been followed by higher volatility and drawdowns.
Conclusion
- Consumer and business confidence rocketed higher post-Trump win, however, this does not square with ultra-low approval ratings.
- The deviation between confidence and approval ratings is nearly its highest ever.
- Similar divergences have historically been followed by higher equity volatility and draw-downs in the year ahead.