Interest Rates
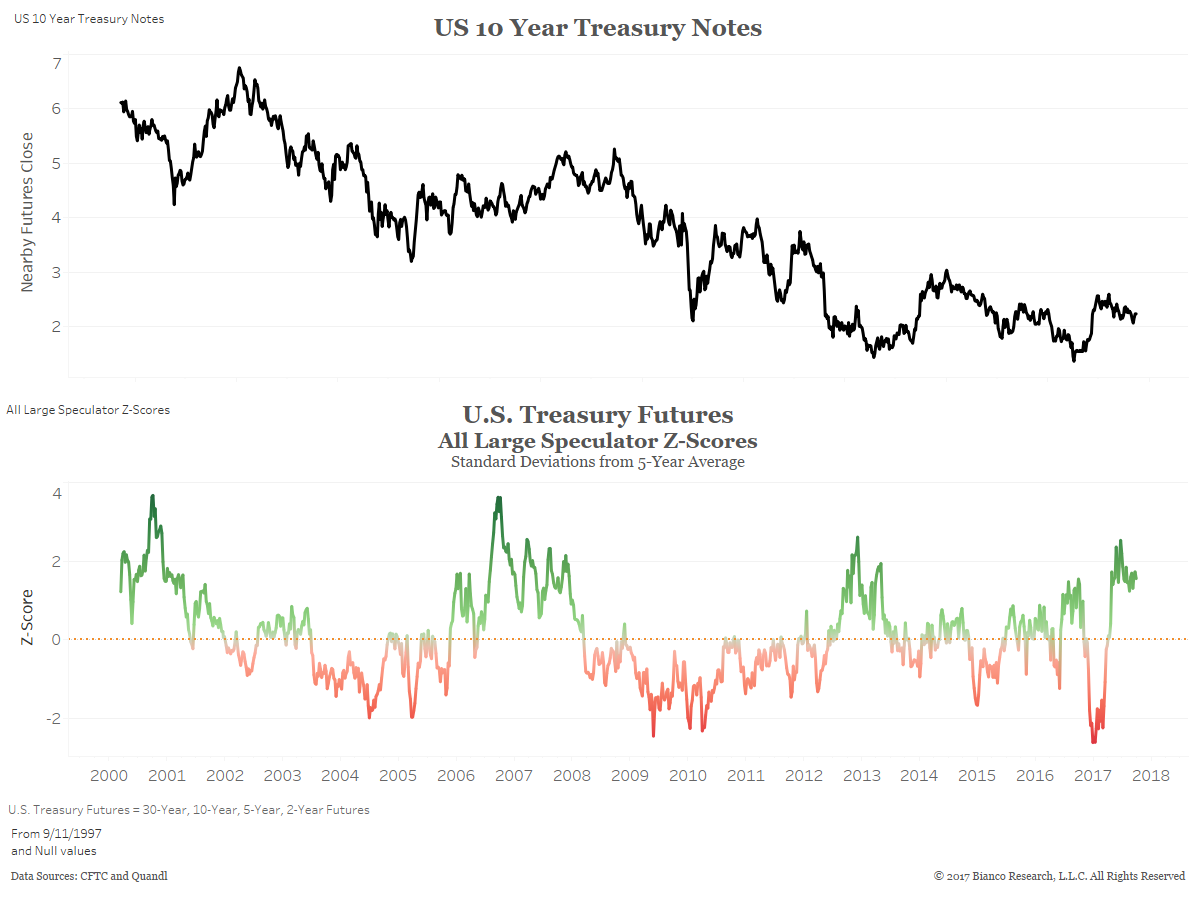
The chart below averages the z-score (standard deviation from 5-year average) for the four Treasury futures (30-year, 10-year, 5-year, 2-year). The top panel shows the 10-year yield and the bottom panel shows the z-score for all large speculators. They are still moderately long Treasuries, which should cap any rally.
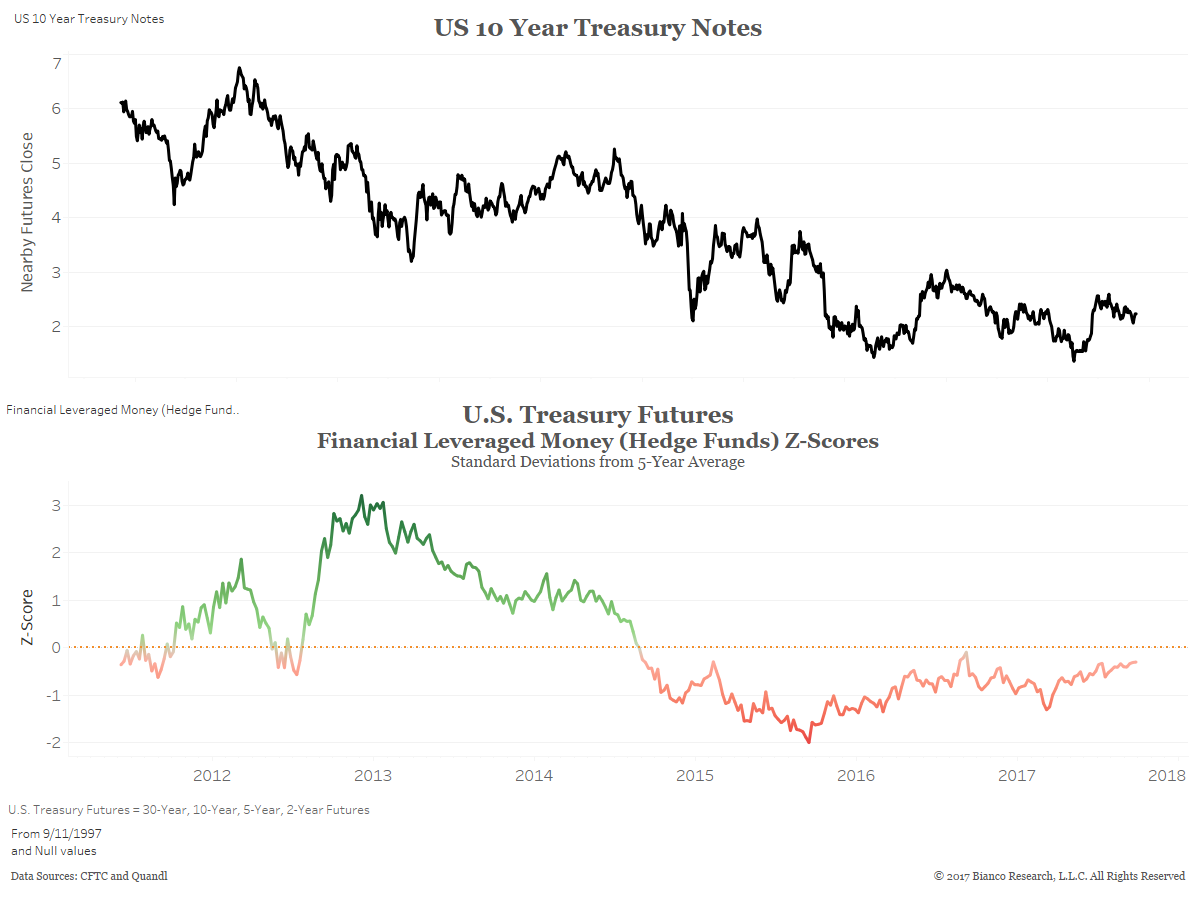
The next chart is the same methodology described above except it shows the average z-score of the leverage traders or hedge funds. They have been below zero since 2014.
Is The Dollar Too Hated?
Readers of this report will note we have been highlighting the “over-speculated” nature of currencies over the past few weeks. This is another way of saying the dollar is too hated.
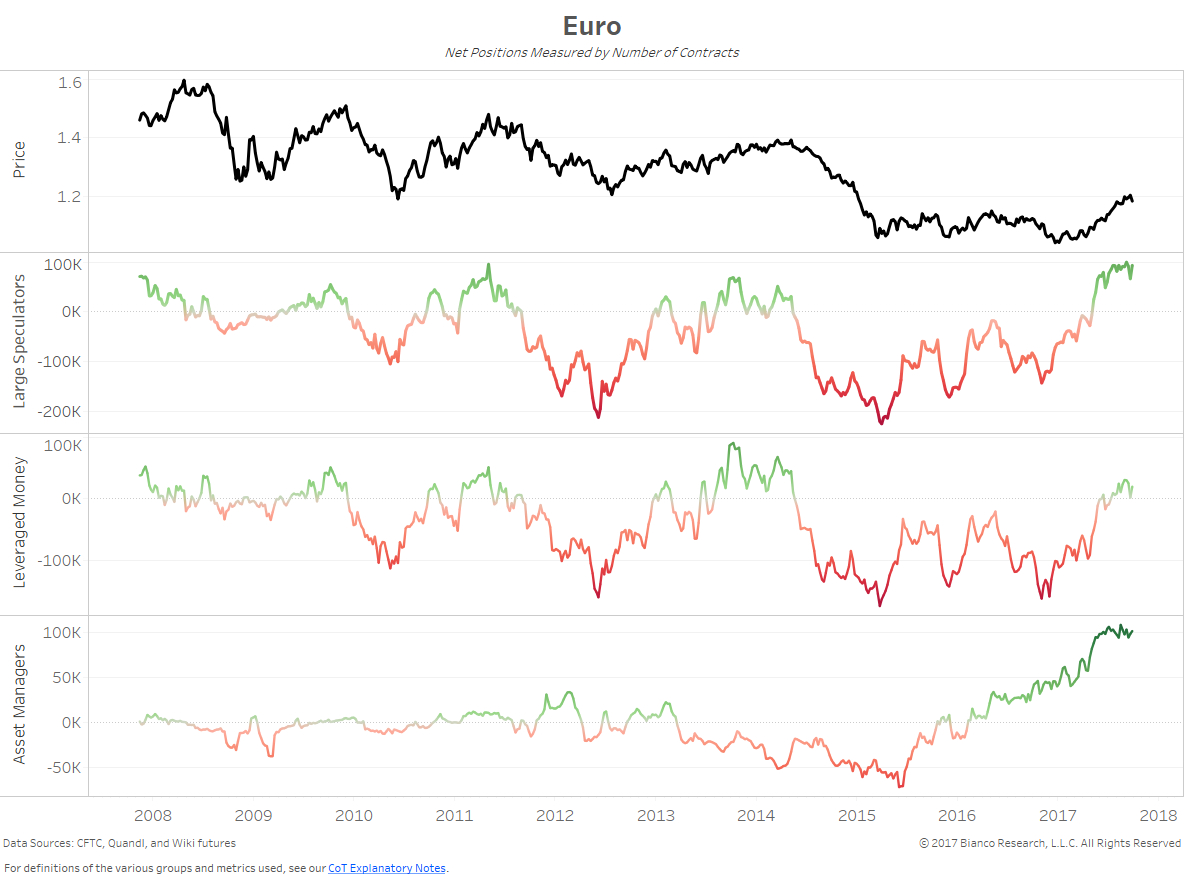
The first chart below shows the euro. The net position of large specs (second panel) remains near multi-year extremes. This is a contrarian category, meaning when it is at an extreme, look for the markets to reverse course.
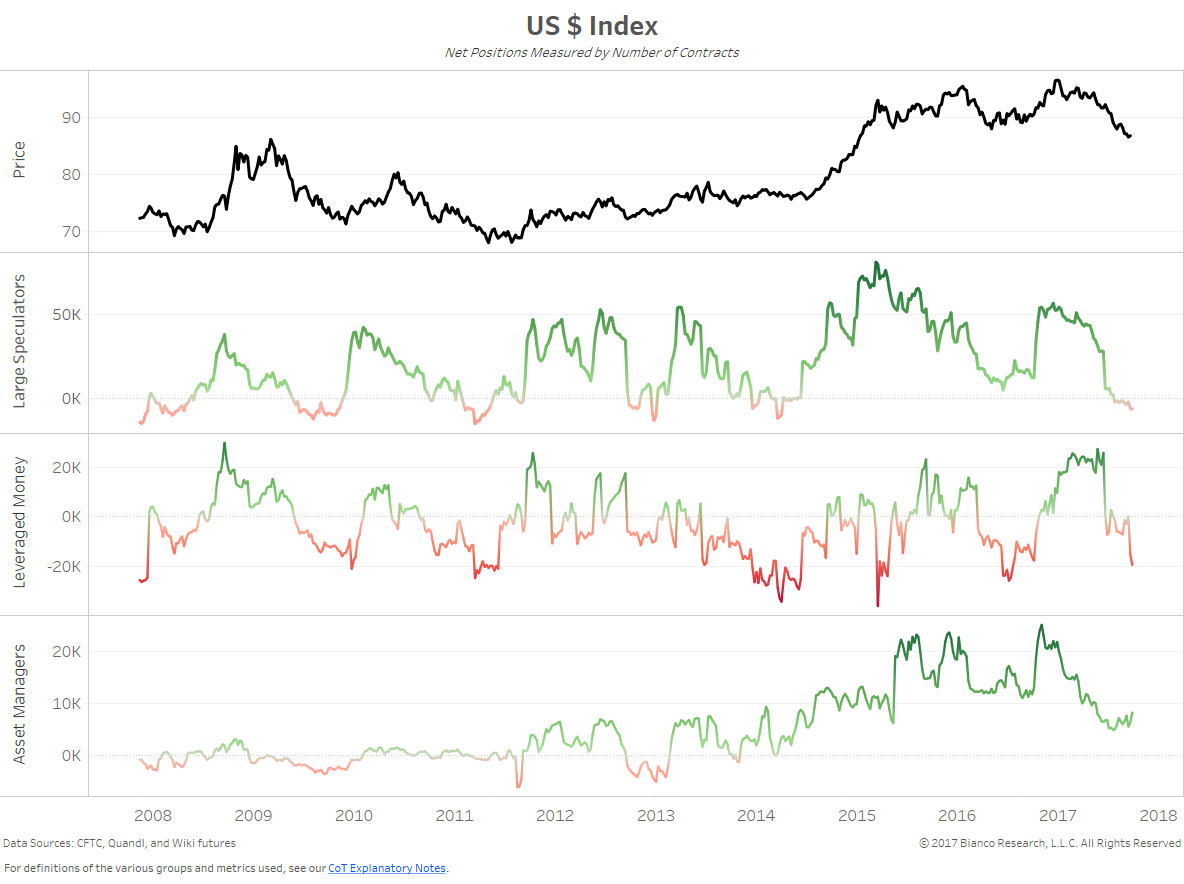
The next chart shows dollar index futures. Large speculators (second panel) have remained net short since late July.
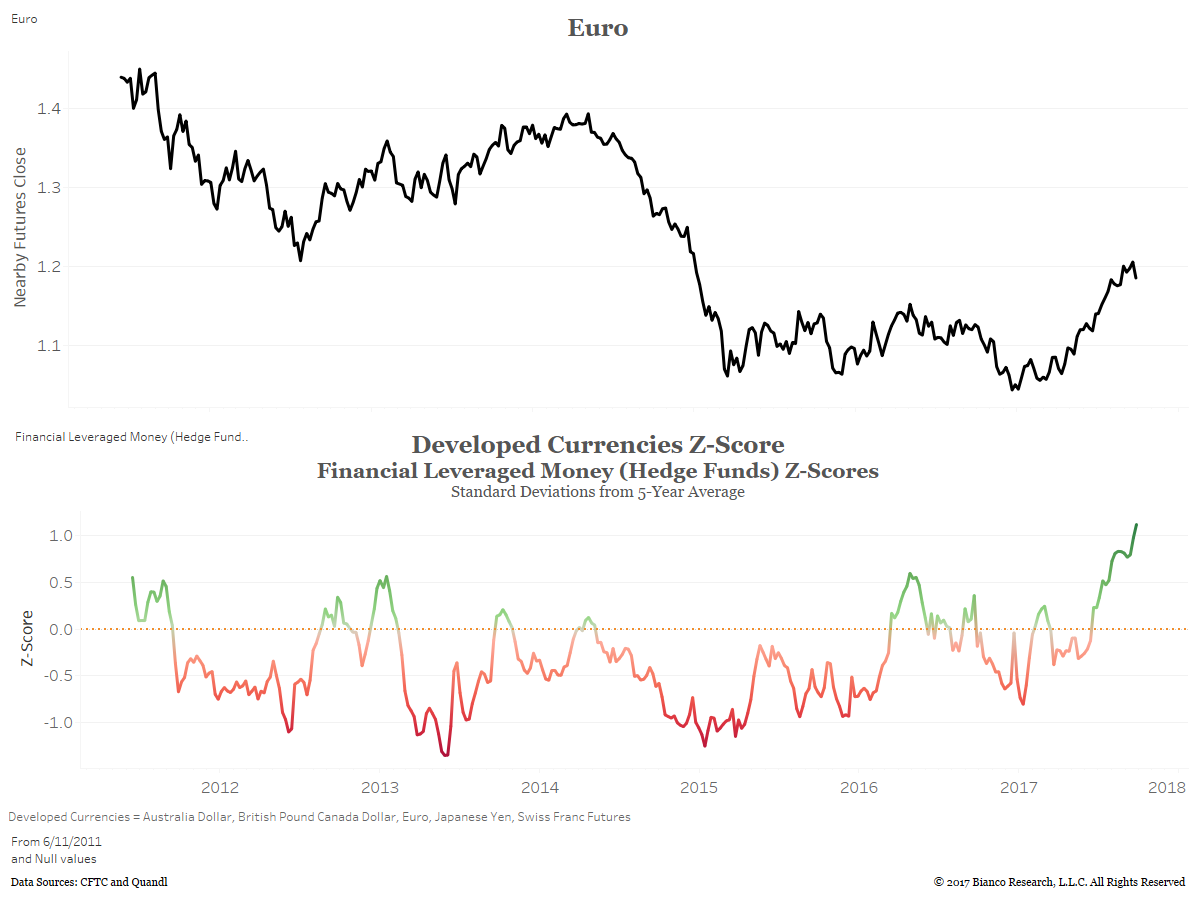
The final charts in this section are from our new sector interactive chart. It averages the z-scores for all large speculators (standard deviation from 5-year average) for the five developed-market currencies (Australia, UK, Canada, Euro, Japan and Switzerland). The top panel shows the euro and the bottom panel shows the z-score for leveraged money (hedge funds). They are at a record long. Typically when this group is at an extreme, the market goes the other way.

The next chart is the same methodology but shows the leveraged traders or hedge funds average z-score in the bottom panel. The continue to move into record long territory marking a contrarian sell signal.
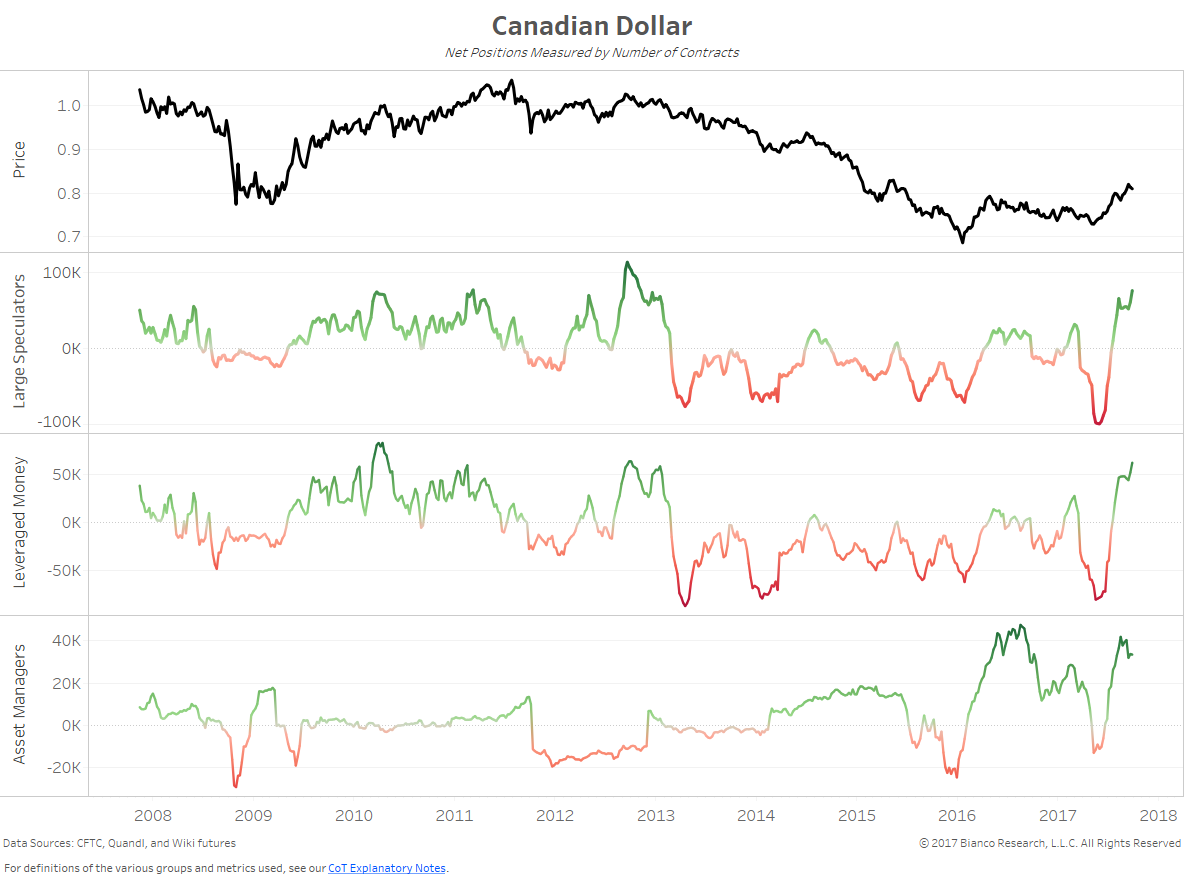
Canadian Dollar
The large speculators (second panel) and leveraged money (third panel) are at four-year extreme net long positions. This is a classic contrarian sell signal.
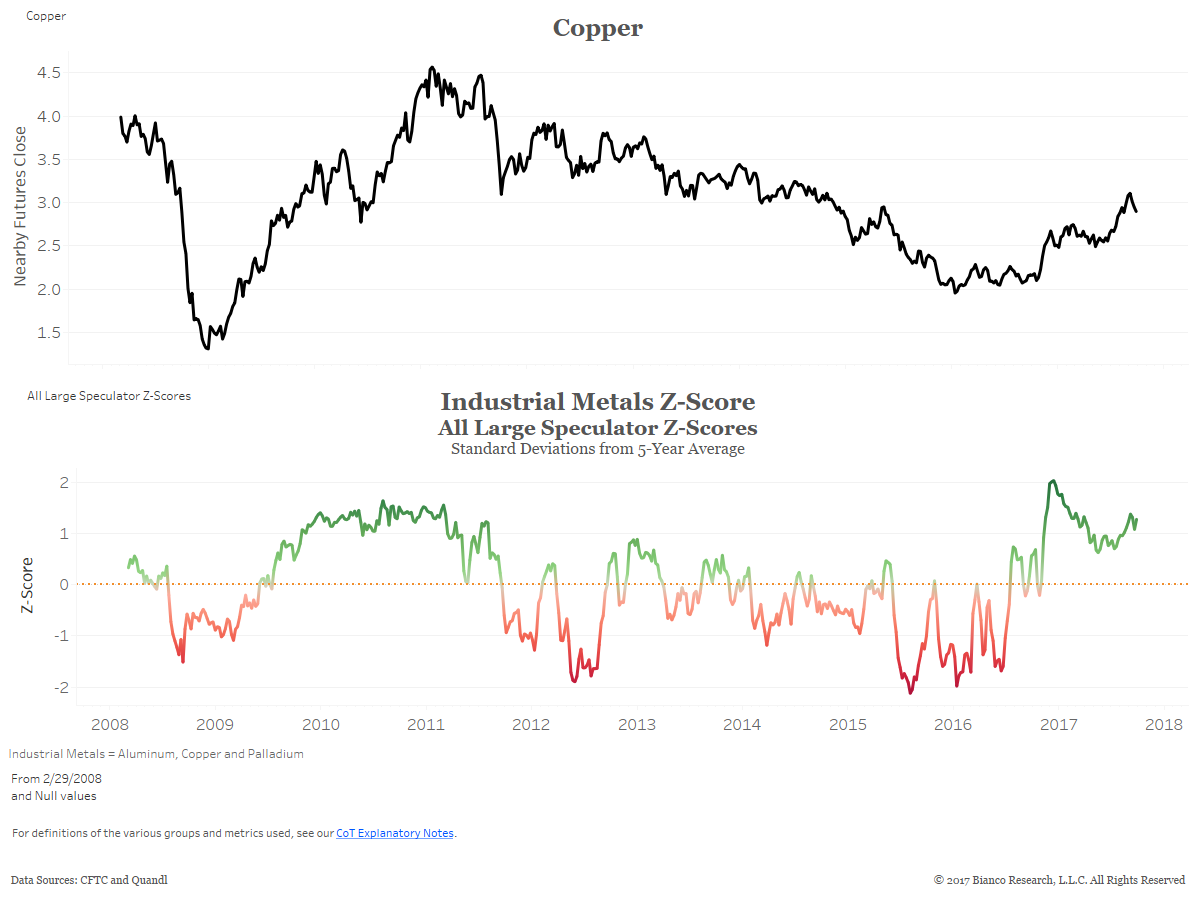
Industrial Metals/Copper
Large speculators’ average z-score (standard deviation from 5-year average) for the three industrial metals (aluminum, copper, and palladium) is also near an extreme high, indicating a contrarian sell signal.
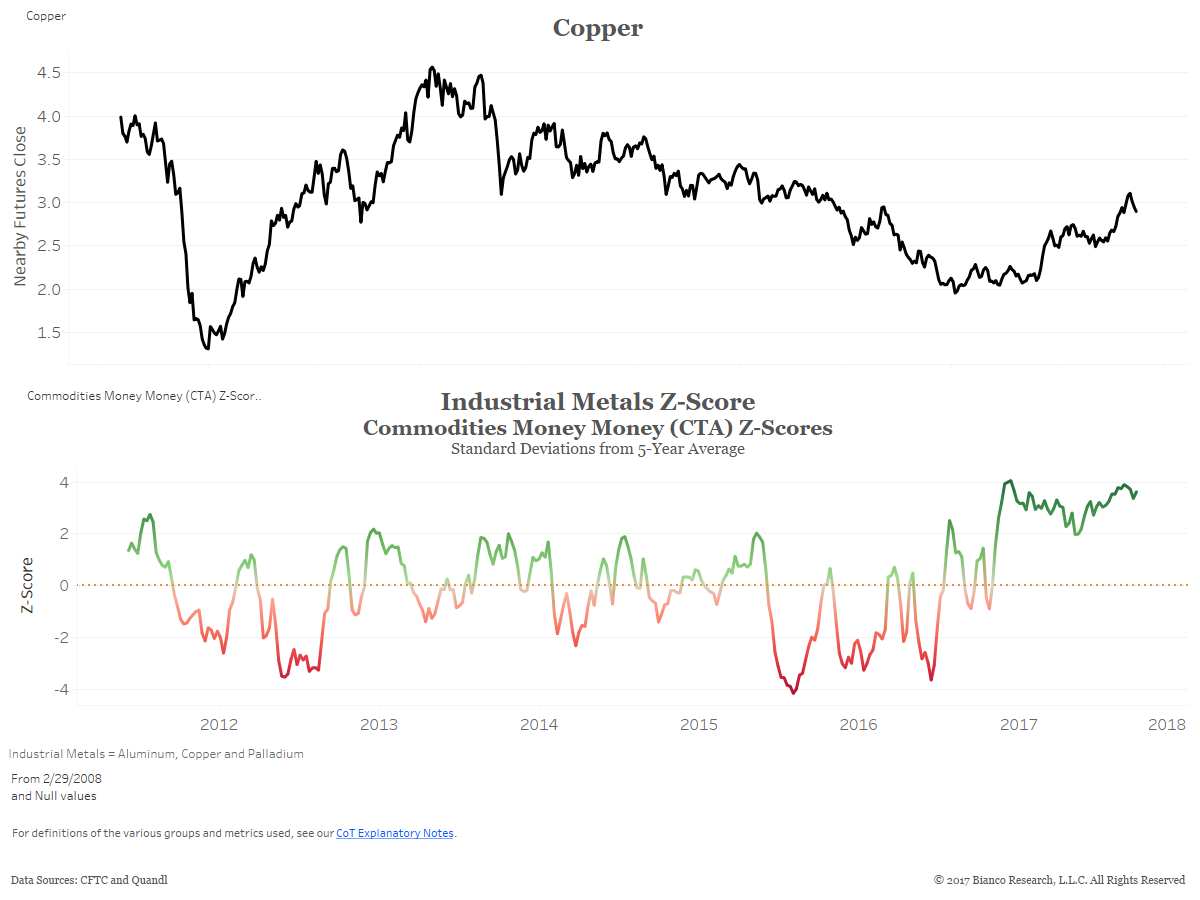
The next chart shows the same methodology for Money Manager CTA Z-Scores. This is another contrarian sell signal.
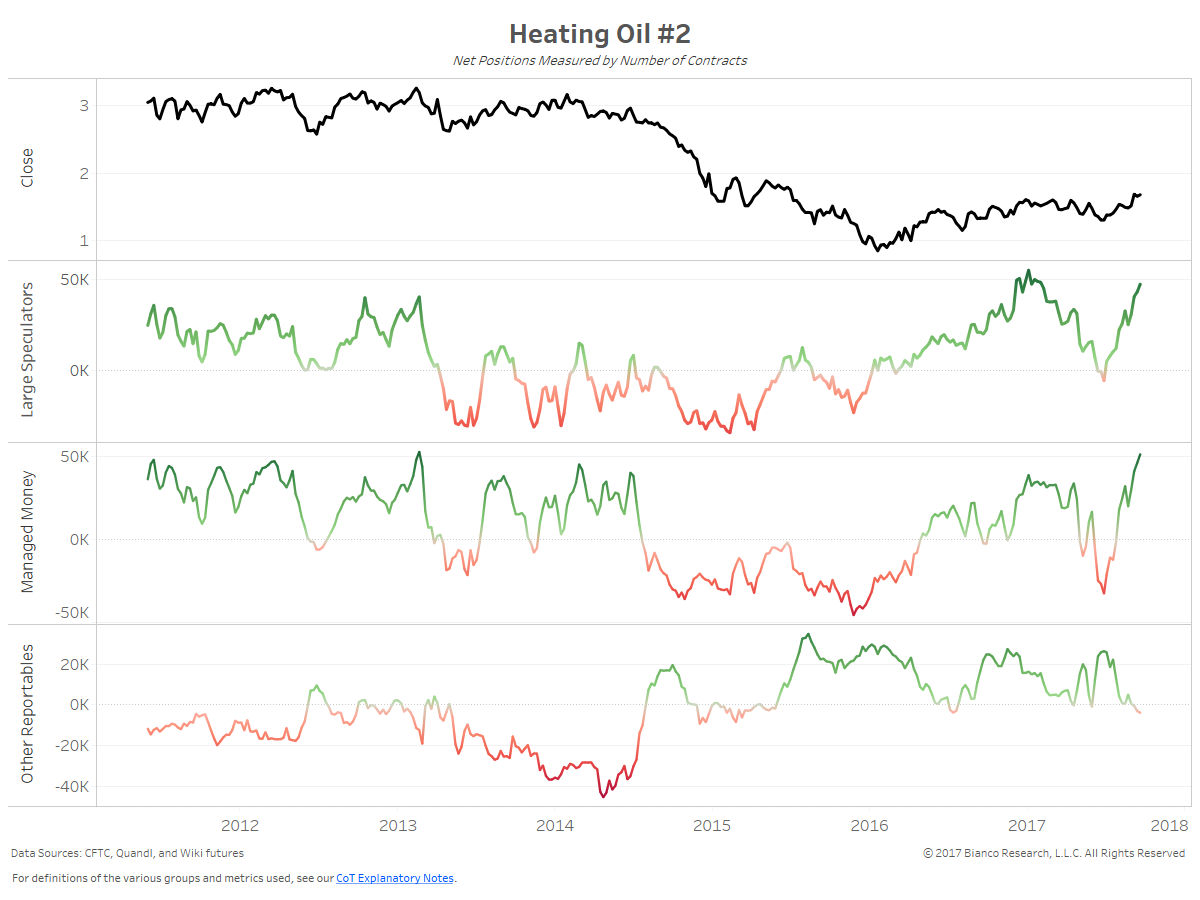
Heating Oil
Managed money continues to buy aggressively, now at their largest net long since 2013.
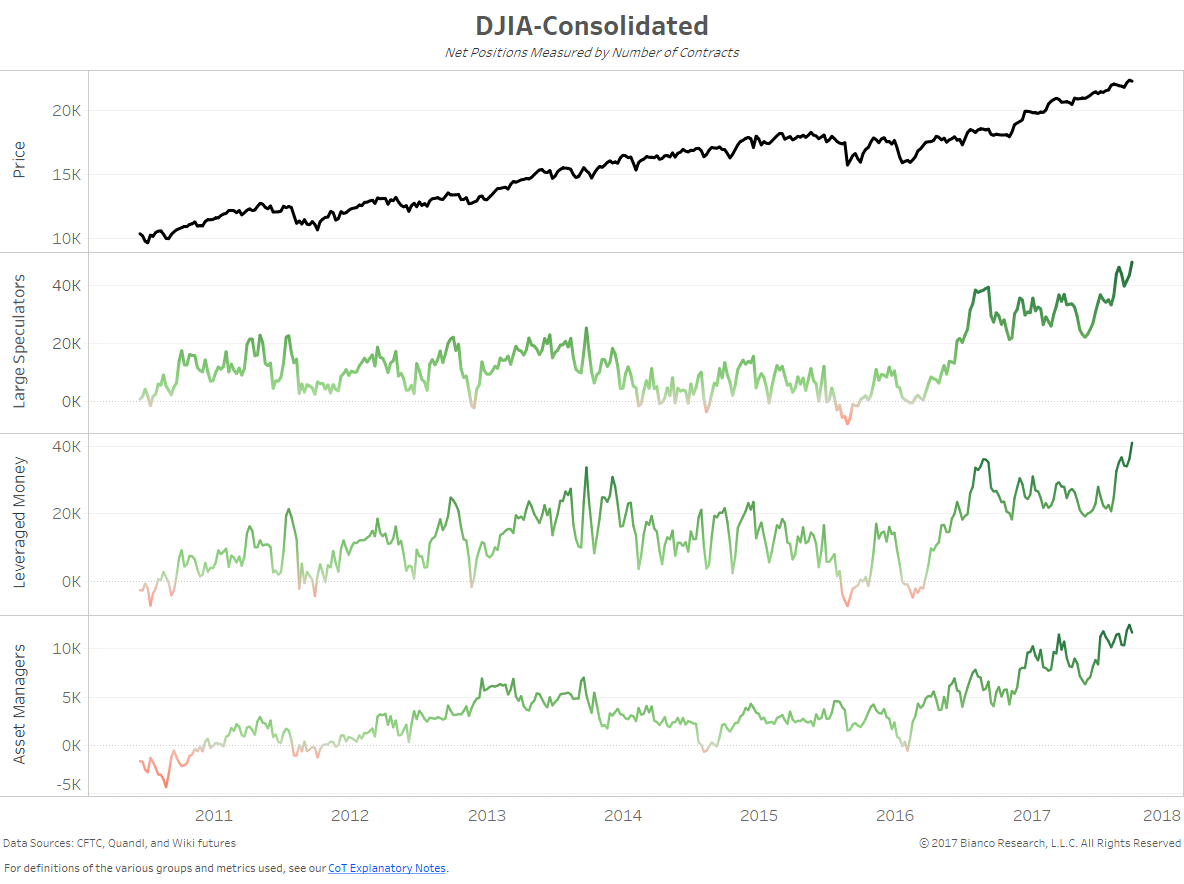
DJIA- Consolidated
Large specs, leveraged money and asset managers all are at or near their record extreme net positions.
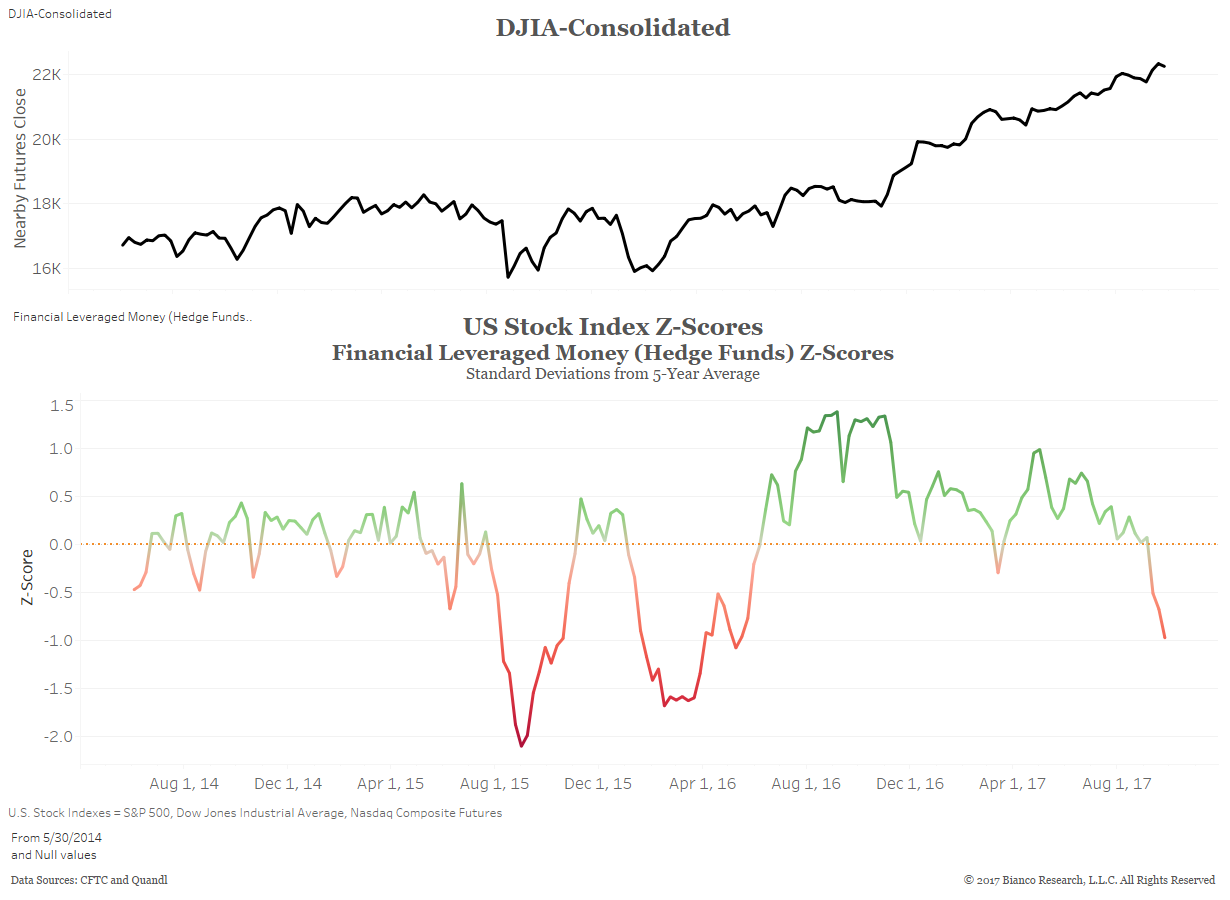
The chart below averages the z-score for the three stock index futures (NASDAQ, DJIA and S&P 600) for the leveraged traders or hedge funds. They have been aggressive sellers the last few weeks which is contrarian buy signal.
On September 29, 2017, the Commodity Futures Trading Commission (CFTC) released the Commitment of Traders (CoT) statistics for Tuesday, September 26, 2017.
Below are some charts of note we selected from our new interactive CoT report below.
Feel free to use that report to change parameters, markets, dates, and measures of each graphic below to explore the CoT data in further detail.