- Reuters – U.S. fed funds rate gap vs interest on excess reserves grows
The average borrowing cost for U.S. banks to borrow excess reserves overnight rose further above what the Federal Reserve pays on excess reserves on Wednesday, according to New York Federal Reserve data on Thursday. …The gap between the two interest rates suggested tighter conditions in money markets this week as investors withdrew huge amounts of cash from bank and money market amounts to make their annual tax payments by the April 15th deadline. The recent widening of the spread between the effective fed funds rate and the IOER has sparked worries about a dwindling amount of reserves that banks lend to one another, stemming from the Fed’s reduction of its balance sheet and the government’s heavy issuance of Treasury bills to fund its spending. - The New York Fed – Lorie K. Logan: Observations on Implementing Monetary Policy in an Ample-Reserves Regime
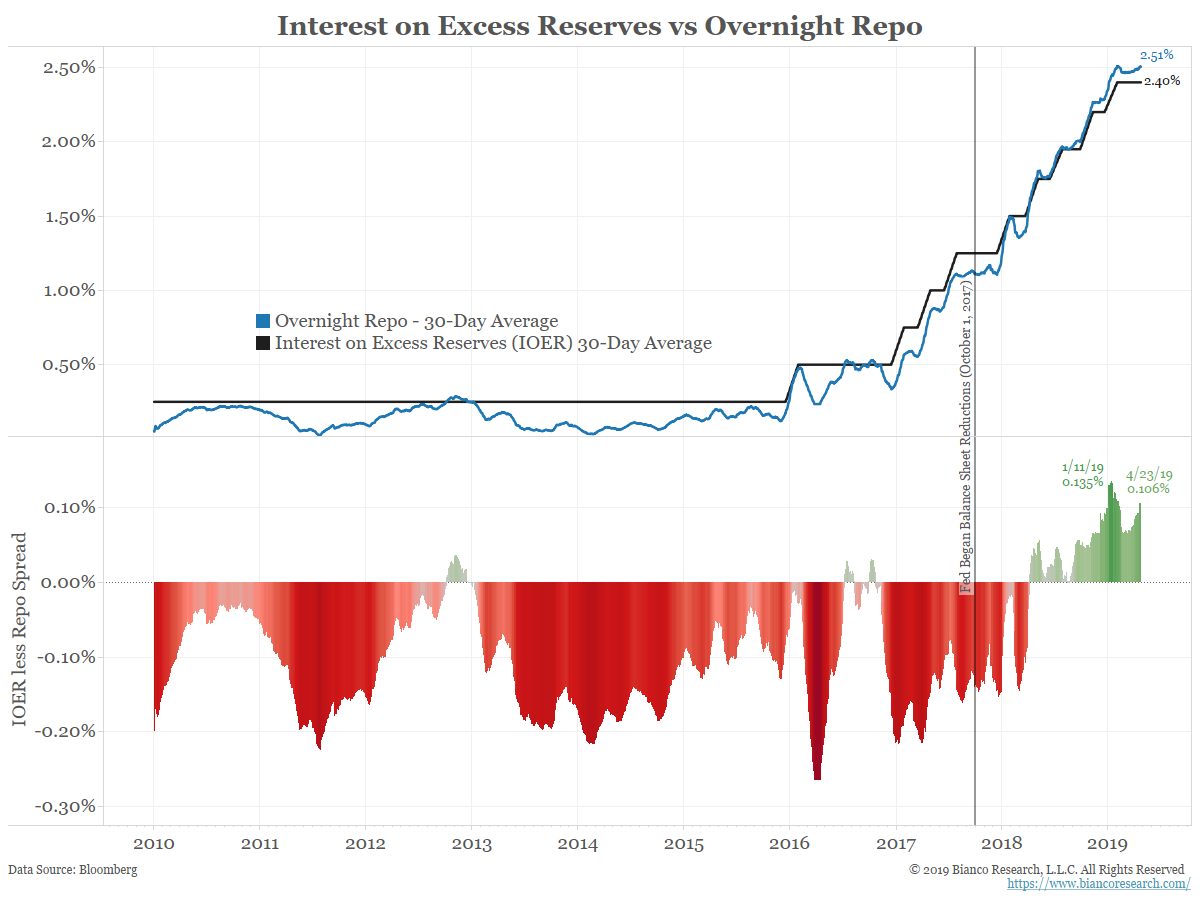
Though rates transacted in the federal funds market are relatively stable, the EFFR has risen one basis point relative to IOER in recent weeks and is now above IOER. Since mid-March, overnight repo rates have generally traded above federal funds rates, providing an attractive investment opportunity for the Federal Home Loan Banks (FHLBs) that invest a portion of their liquidity portfolios in both markets. As the dominant lenders in the federal funds market, FHLBs may have been able to negotiate higher overnight lending rates with banks that regularly use federal funds to fund non-reserve assets or meet payments, and on occasion with banks that borrow to improve their Liquidity Coverage Ratios (LCR) by borrowing from government-sponsored enterprises.
Summary
Comment
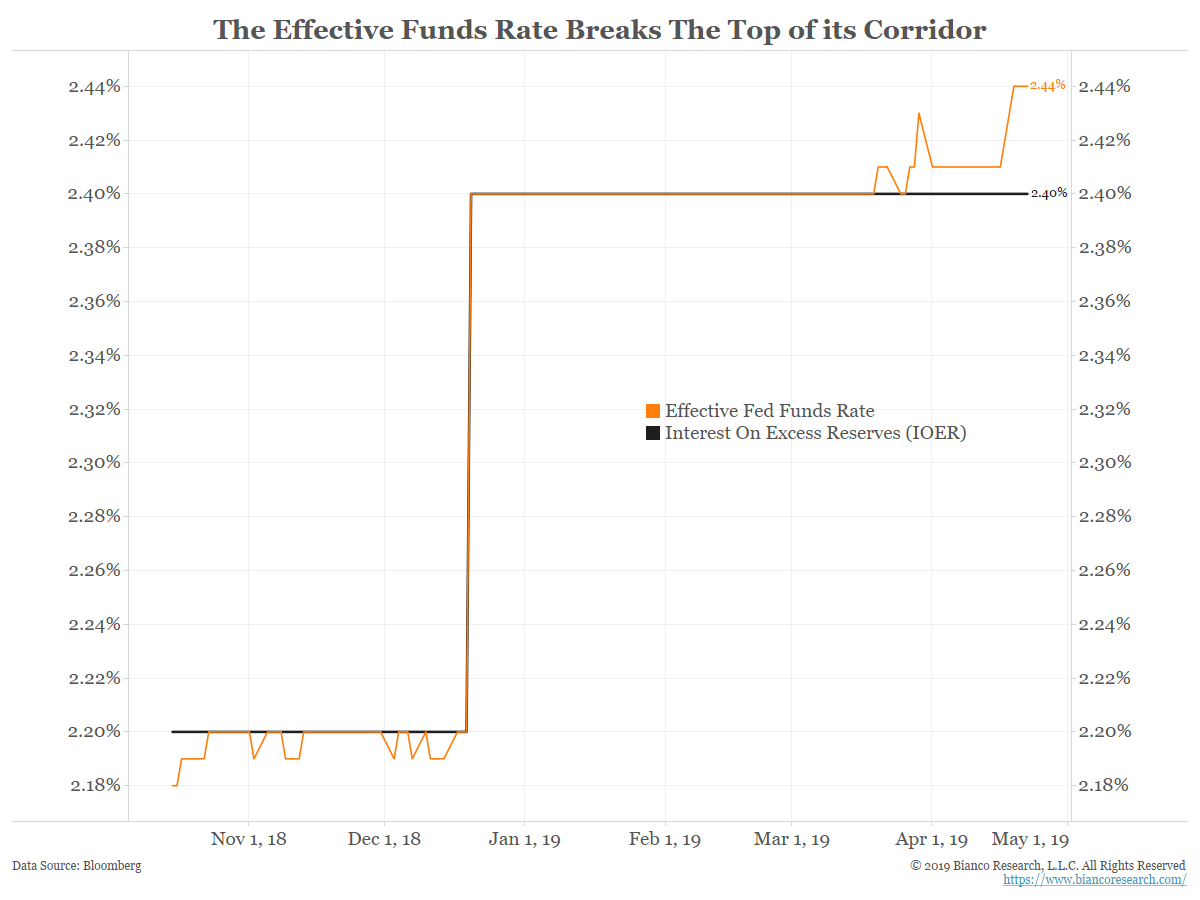
As the chart above shows, the EFFR has broken above the IOER rate. This first happened on March 20, 2019, the day of the FOMC meeting that announced a tapering of balance sheet reductions.
This was not supposed to happen. The July 2014 FOMC minutes explained IOER was supposed to be the ceiling for the EFFR:
Participants agreed that adjustments in the IOER rate would be the primary tool used to move the federal funds rate into its target range and influence other money market rates. In addition, most thought that temporary use of a limited-scale ON RRP facility would help set a firmer floor under money market interest rates during normalization. Most participants anticipated that, at least initially, the IOER rate would be set at the top of the target range for the federal funds rate, and the ON RRP rate would be set at the bottom of the federal funds target range.
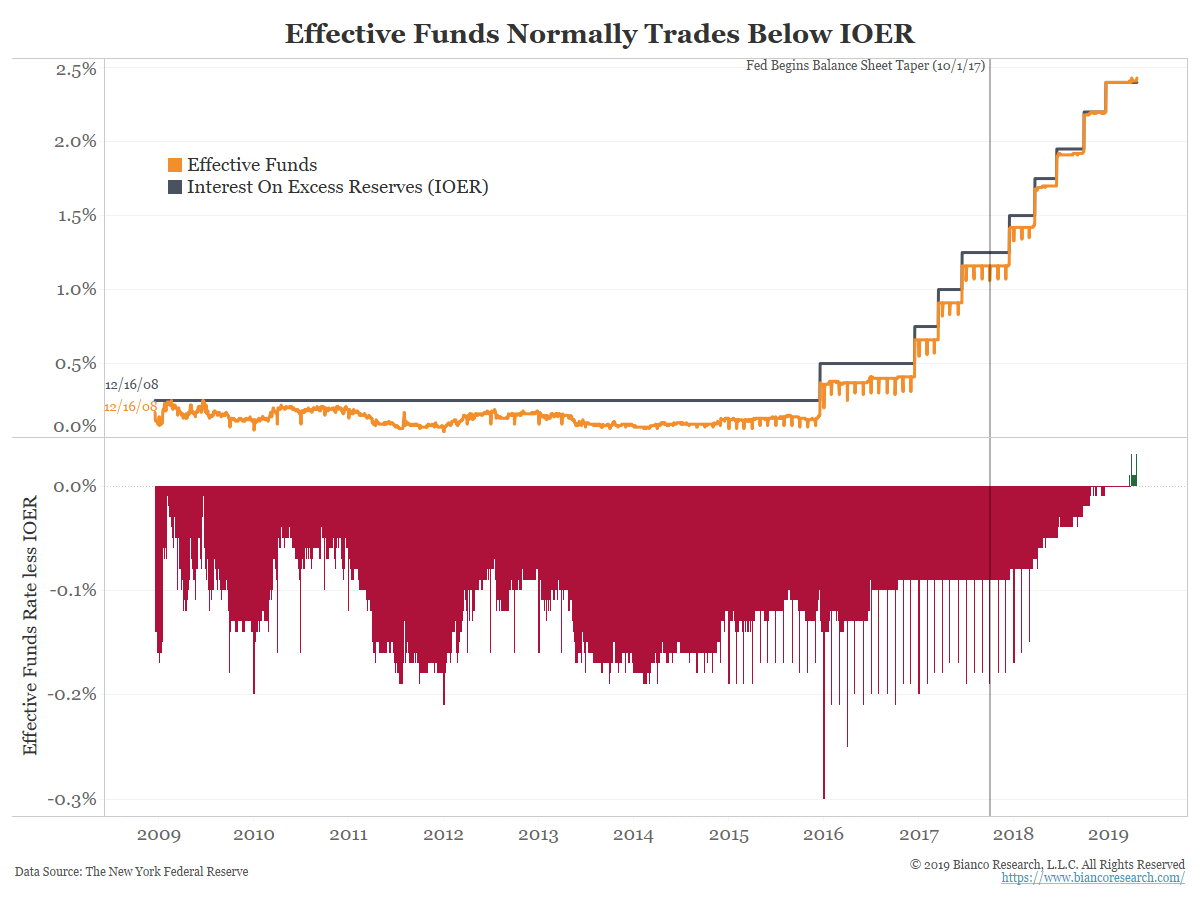
As the chart below shows, IOER did indeed establish the upper end of the funds rate. Furthermore, the spread between EFFR and IOER was fairly stable.
But soon after the Fed started reducing its balance sheet, this spread began to narrow. The Fed initially blamed T-Bill issuance as the reason the EFFR was moving closer to IOER, although the issue persisted. In order to keep the effective rate closer to their desired target, they began adjusting IOER relative to their target rate. First they adjusted IOER 5 basis points below their target rate. In December they adjusted IOER to 10 basis points below their target rate. As a result, the top of the Fed’s target rate is 2.50%, but IOER is stuck at 2.40%. Knowing that the effective rate now trades much closer to IOER, this helped keep the effective rate closer to the middle of their targeted range between 2.25% and 2.50%.
Unfortunately for the Fed, the effective rate is now trading four basis points above the IOER rate.
The effective rate trading above IOER is a sign that the funds market is becoming tight, more illiquid.
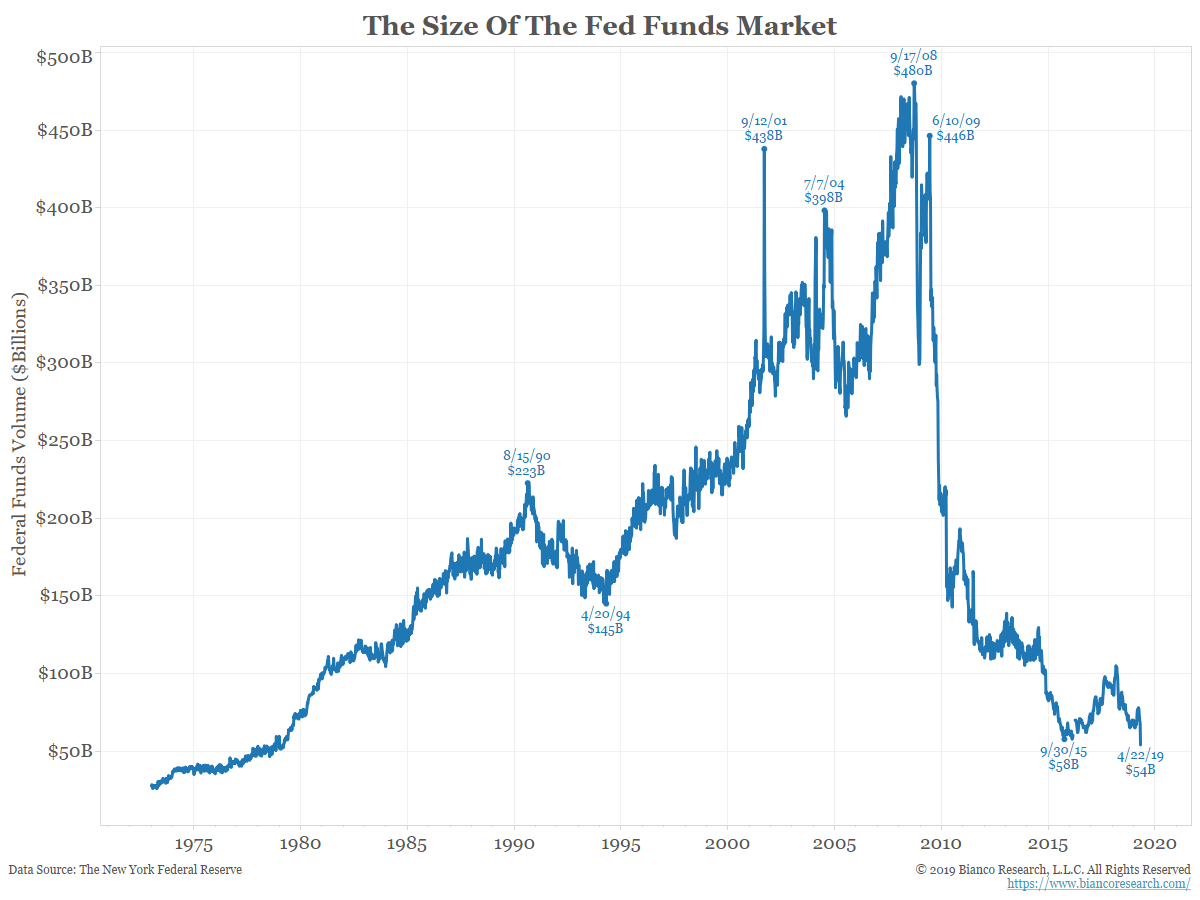
Part of this is due to the complete disappearance of the fed funds market. The chart below shows fed funds volume is at a 40-year low and nearly 90% off its pre-crisis peak.
Conclusion
The fact that the effective rate is trading above the IOER rate is not yet a serious issue. However, if the current trend continues, the effective rate will soon be trading above the top end of the Fed’s 2.25% to 2.50% target range.
If this were to happen, the concern would be that the Fed has lost control over its ability to set rates. Some sort of policy response would be needed. With only 7 basis points to go before the effective rate trades above the Fed’s target range, this is an issue worth monitoring.