Summary
- As of Friday, the Hubei Province could conduct 6,000 coronavirus tests a day. Officials said this capacity is increasing by 200 tests a day.
- 30% of all tests are negative. Or, it takes 1.4 tests to find one positive result.
- Three days of fever and changes on a CT scan are also necessary for diagnosis.
- To be cleared as “recovered,” you must pass at least two tests.
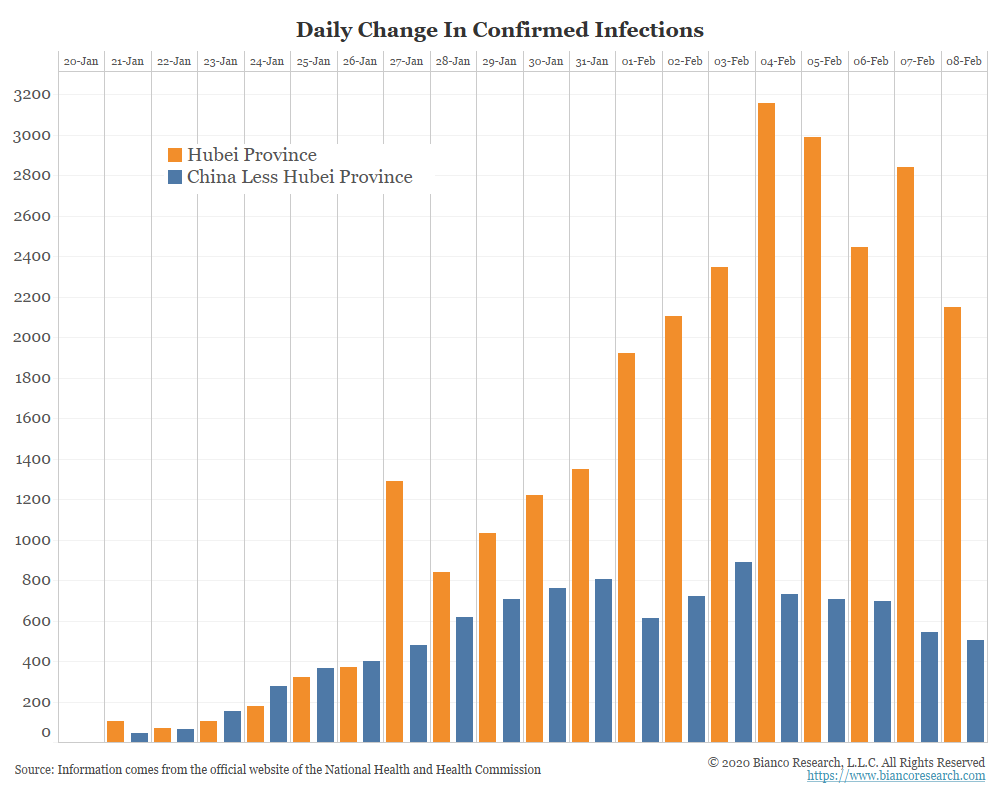
The Chinese government does provide data broken down by Province. The peak is both Hubei (orange) and the rest of China (blue) is what is giving hope worst of the coronavirus has passed,
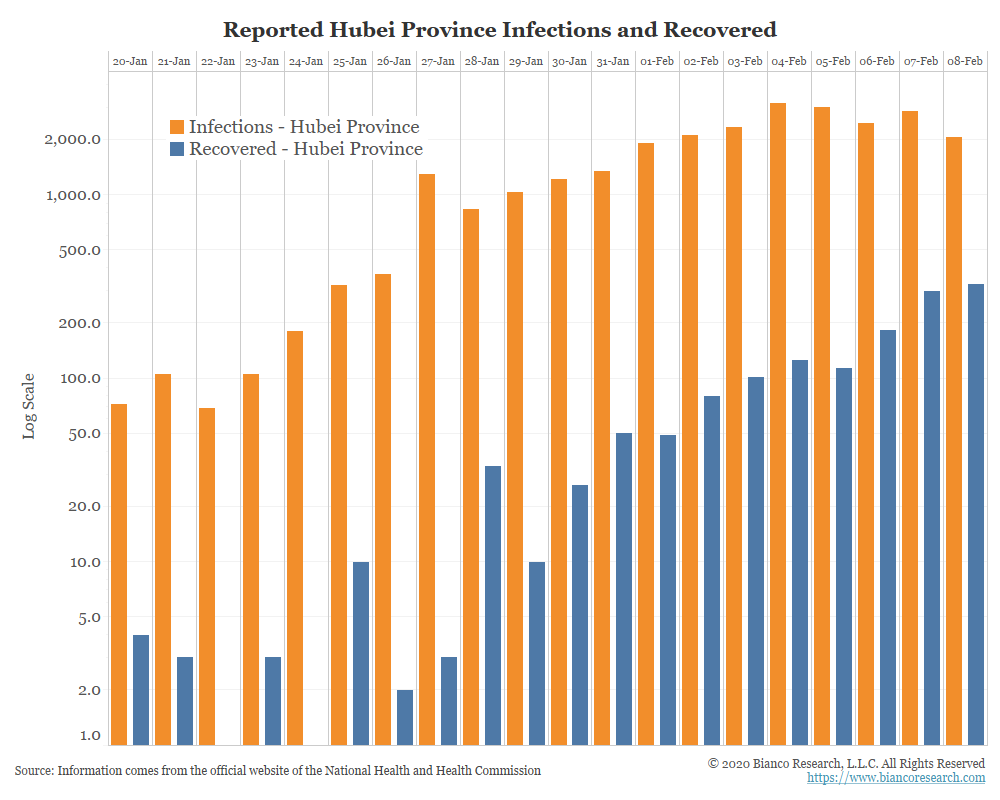
Note above that as infection growth rate has leveled off (orange), recoveries continue to surge (blue).
As the officials noted above, it takes 1.4 tests (30% of all tests come back negative) along with three days of fever and a change in a CT scan to be diagnosed as infected. So, it is reasonable to assume some of these had more than one test.
Additionally, it takes at least two tests to clear someone as recovered.
Capacity
The next chart using the data given to us and calculates the testing capacity in Hubei province. The orange line assumes 6,000 tests per day on Friday, February 7. It also assumes testing capacity has been growing at 200 a day for the last several days, as stated.
The blue line multiples the number of daily infections by 1.4 (30% are negative) and recovered by 2 (takes two negative tests to be cleared). The bottom panel (red) shows the testing capacity.
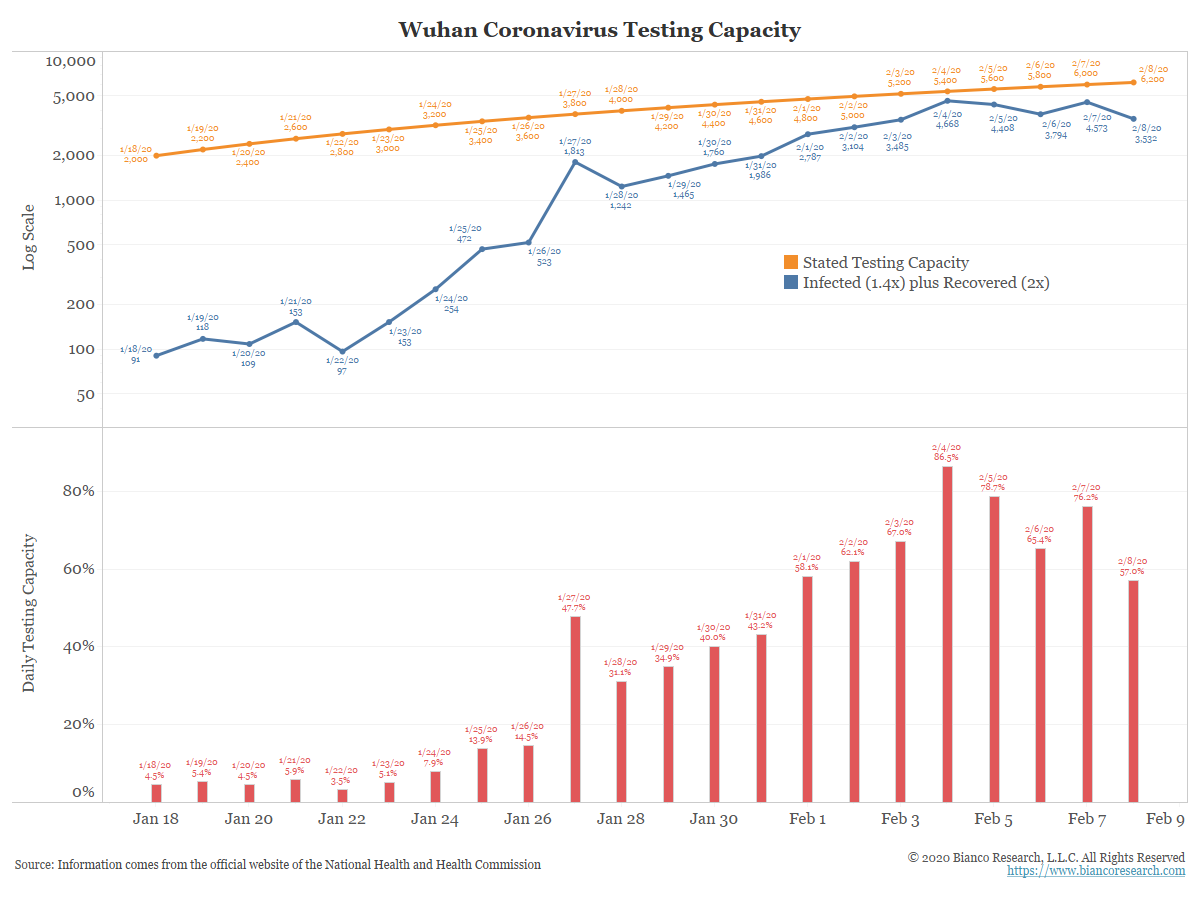
The charts above show that infections peaked on February 4. The chart immediately above shows that the testing capacity hit 85% on February 4 as well.
In other words, on February 4 they hit the ceiling on the number of tests that can perform. This assumes no tests are no mistakes, no patients having multiple tests, and it assumes the negative test rate of 30% is constant every day.
In other words, the officials in Hubei province cannot keep up and are reporting what they can do, not how much the coronavirus is actually growing.
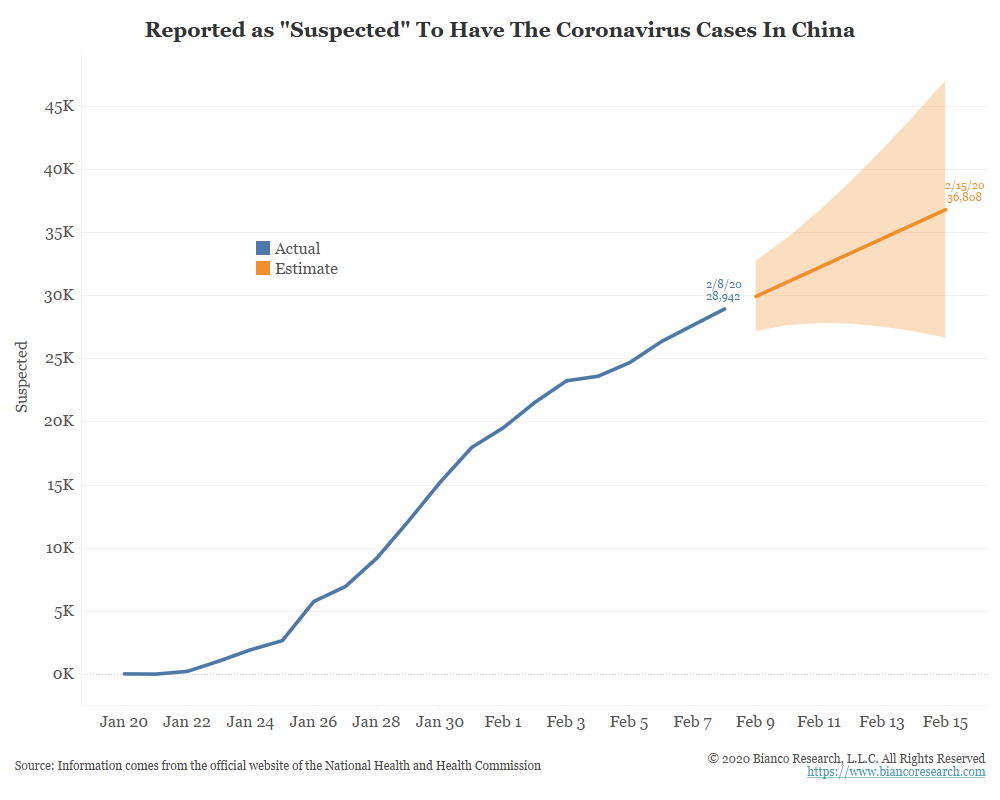
Backlog
The next chart shows “suspected cases for all of China. We cannot find this number broken down by Province. But if we assume, like other province statistics, half to two-thirds are in Hubei Province, or 15,000 to 18,000, this “backlog” means will take about 5 to 7 days from suspected to confirmed as infected.
Conclusion
To measure something like this coronavirus is way beyond the capacity of the Chinese Health Care System. So, modeling is needed.
Bloomberg had this worrisome story over the weekend
- Bloomberg.com – Coronavirus May Infect Up to 500,000 in Wuhan Before It Peaks
Study projects mid-to-late-February coronavirus peak in Wuhan
By then, at least 1 in 20 residents might have been infectedThe new coronavirus might have infected at least 500,000 people in Wuhan, the Chinese city at the epicenter of the global outbreak, by the time it peaks in coming weeks. But most of those people won’t know it. The typically bustling megacity, where the so-called 2019-nCoV virus emerged late last year, has been in effective lockdown since Jan. 23, restricting the movement of 11 million people. Recent trends in reported cases in Wuhan broadly support the preliminary mathematical modeling the London School of Hygiene & Tropical Medicine is using to predict the epidemic’s transmission dynamics. … Based on that, a prevalence of 5% equates to about 500,000 cumulative infections. That’s many times more than the 16,902 cases provincial health authorities had counted in Wuhan as of midnight Sunday.
Note that this is in Wuhan, which is 11 million of the estimated 50 million in Hubei Province, or the 1.4 billion in China. With testing able to handle a few thousand a day, we may never know the true extent of this virus.
Official statistics show that the coronavirus growth rate peaked a few days ago. Many hope this is a sign that the worst of the coronavirus is behind us. But more evidence is emerging that these statistics are not the measures of the virus growth, but rather the capacity of the Chinese health care system to deal with this problem.
Comment
On Friday, February 7, the government of central China’s Hubei Province (Wuhan) briefed the public on containing the novel coronavirus after more than 20,000 cases have been confirmed as of Friday in the province, the epicenter of the outbreak, since the crisis began.