- Bloomberg – Maybe Worker Inequality Isn’t Inevitable After All
In the 2000s and coming out of the great recession, increased inequality between educated knowledge workers and less-educated and goods-producing workers seemed inevitable. For college-educated workers, there were three areas of job growth: office jobs, education and health care. Goods-producing jobs like those in the manufacturing and construction industries were slowly shrinking as a percentage of total employment, and younger workers were better off staying away from those industries. Less-educated workers got stuck with whatever was left, typically in industries like retail or leisure and hospitality. - Bloomberg – Many Americans Still Feel the Sting of Lost Wealth
The housing crash hurt the poor and middle class more than the rich, who rode the bull stock market.The average household in the top 10 percent of today’s wealth distribution is almost three times as rich as the average household in the top 10 percent of 1971’s distribution. Meanwhile, the average household in the bottom half is slightly poorer. This is a striking demonstration of rising inequality, but it also tells a story about the last few decades of American economic life. Beginning in the late 1990s, the upper half of the wealth distribution started to pull away from the lower half, but on the eve of the housing crash, all three categories had seen a steady gain in wealth since 1950. A person living in July 2006, looking back on the past half-century, could feel reasonably comfortable that most Americans were still living the dream of steadily rising wealth.
Summary
Comment
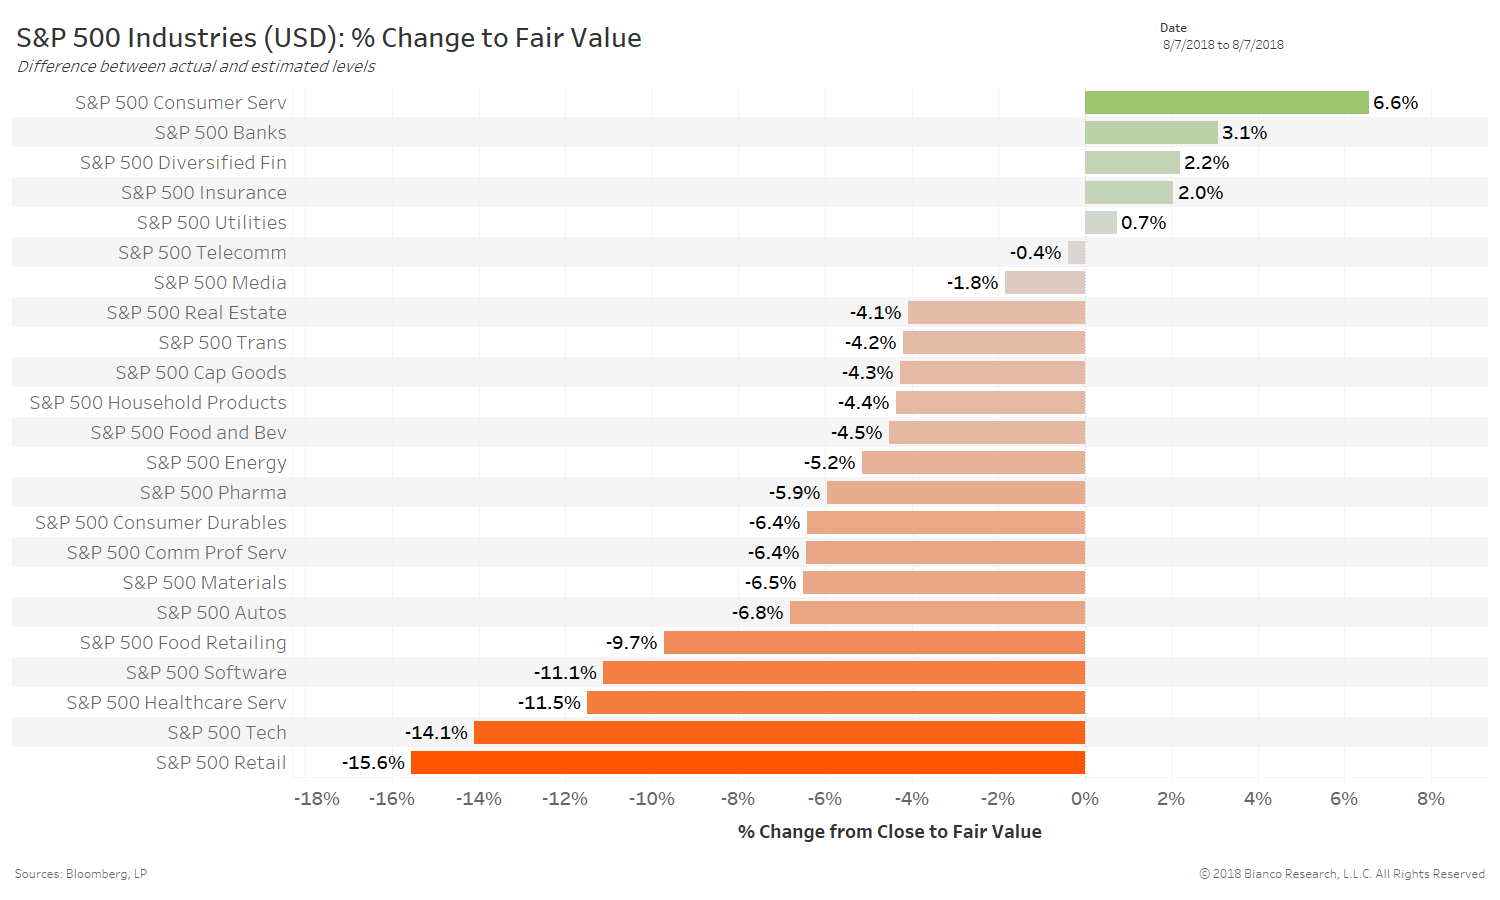
The chart below shows returns assuming each industry of the S&P 1500 moves back to our fair value estimates. We use Google search trends for a more real-time assessment of consumer and business activity, along with traditional economic data to estimate current levels of each industry.
The consumer services industry stands out as the most apt to rally (6.6%), followed by banks (3.1%) and diversified financials (2.2%). Consumer services includes leisure industries like hotels and cruise lines.
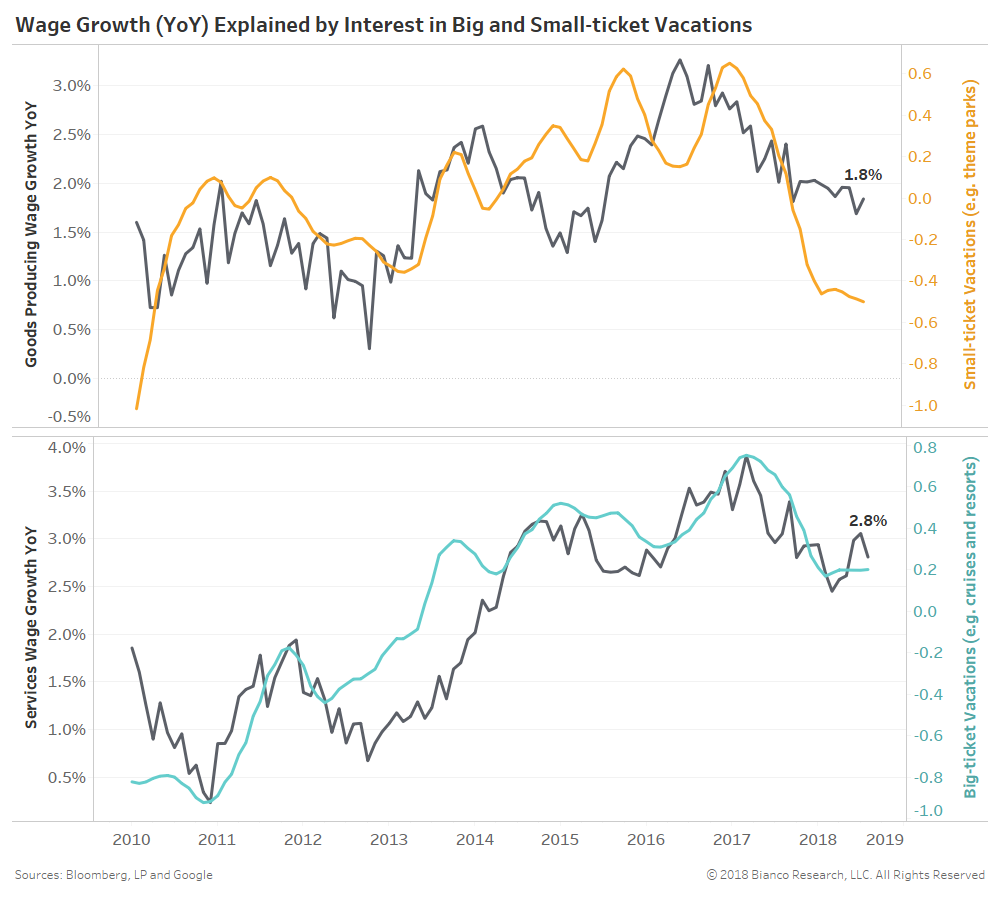
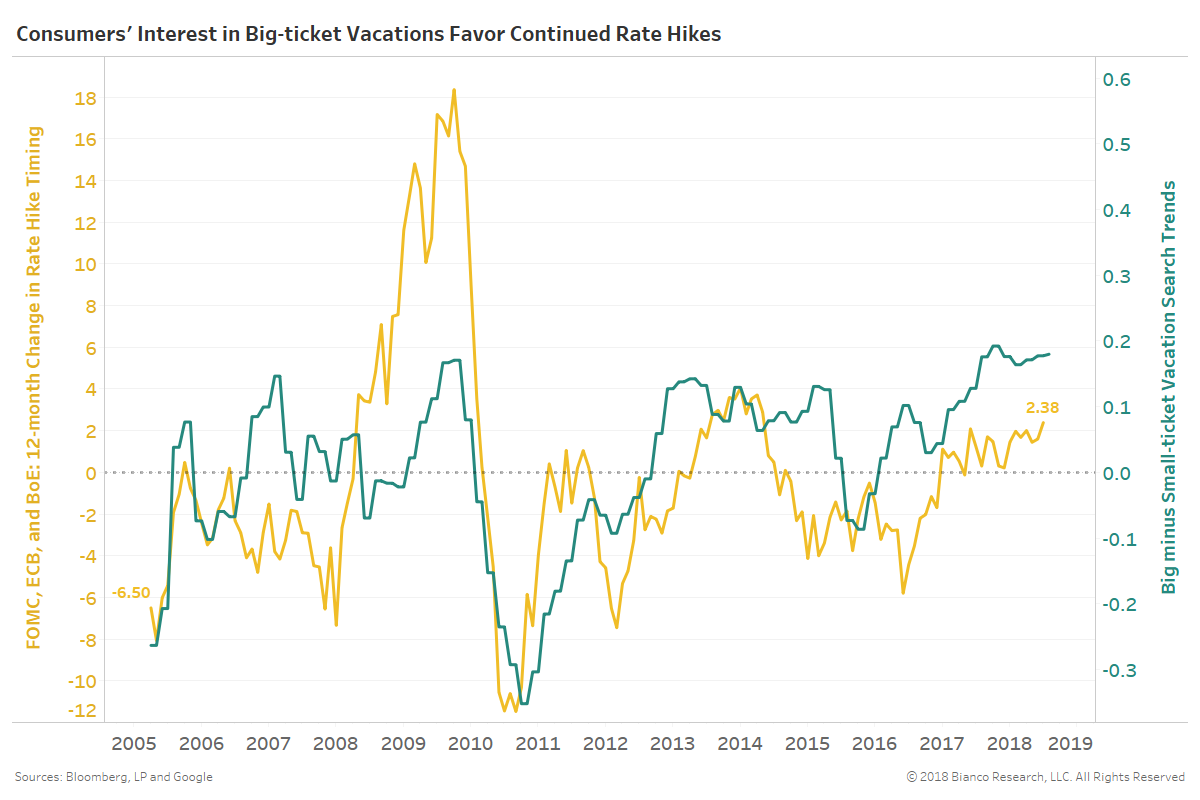
The difference between consumer interest in big and small-ticket vacations (green) has a connection to rate hike timing across the FOMC, ECB, and BoE (yellow). The U.S. and much of Europe are a service-based economies, therefore rising interest and spending across services industries should correlate to the hawkish rhetoric of central bank officials.
For now, a rising pace of rate hike timing (2.4 hikes) is in line with higher expected spending across the services industries.
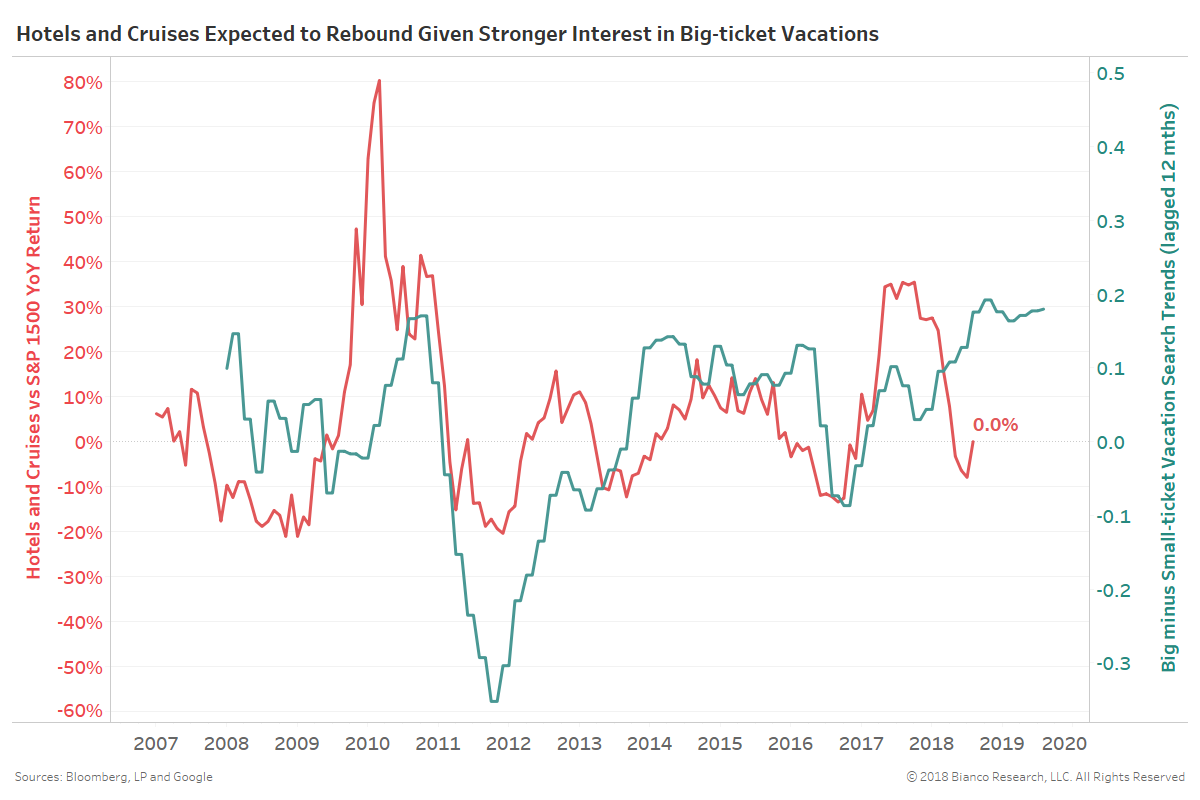
The last chart again shows the difference between consumer interest in big and small-ticket vacations (green), but along with the relative return (YoY) of hotel and cruise companies within the S&P 1500. Examples include Carnival, Wyndham, Belmond, and Hilton, and Norwegian.
Since the beginning of the year these companies have suffered losses of -7.1% versus the S&P 1500’s solid gain of +7.1%. Such extreme under-performance has historically offered favorable opportunities to boost allocations to these service-based industries.