Summary
Comment
Responses to surveys about the economy are showing much less attachment to reality, meaning future changes in growth and/or inflation. Similarly, positioning in both risk and safe assets have become slower-moving with an ability to persist for months on end. We can partially blame passive investing, but its rising force is more a product of this herd effect than instigator.
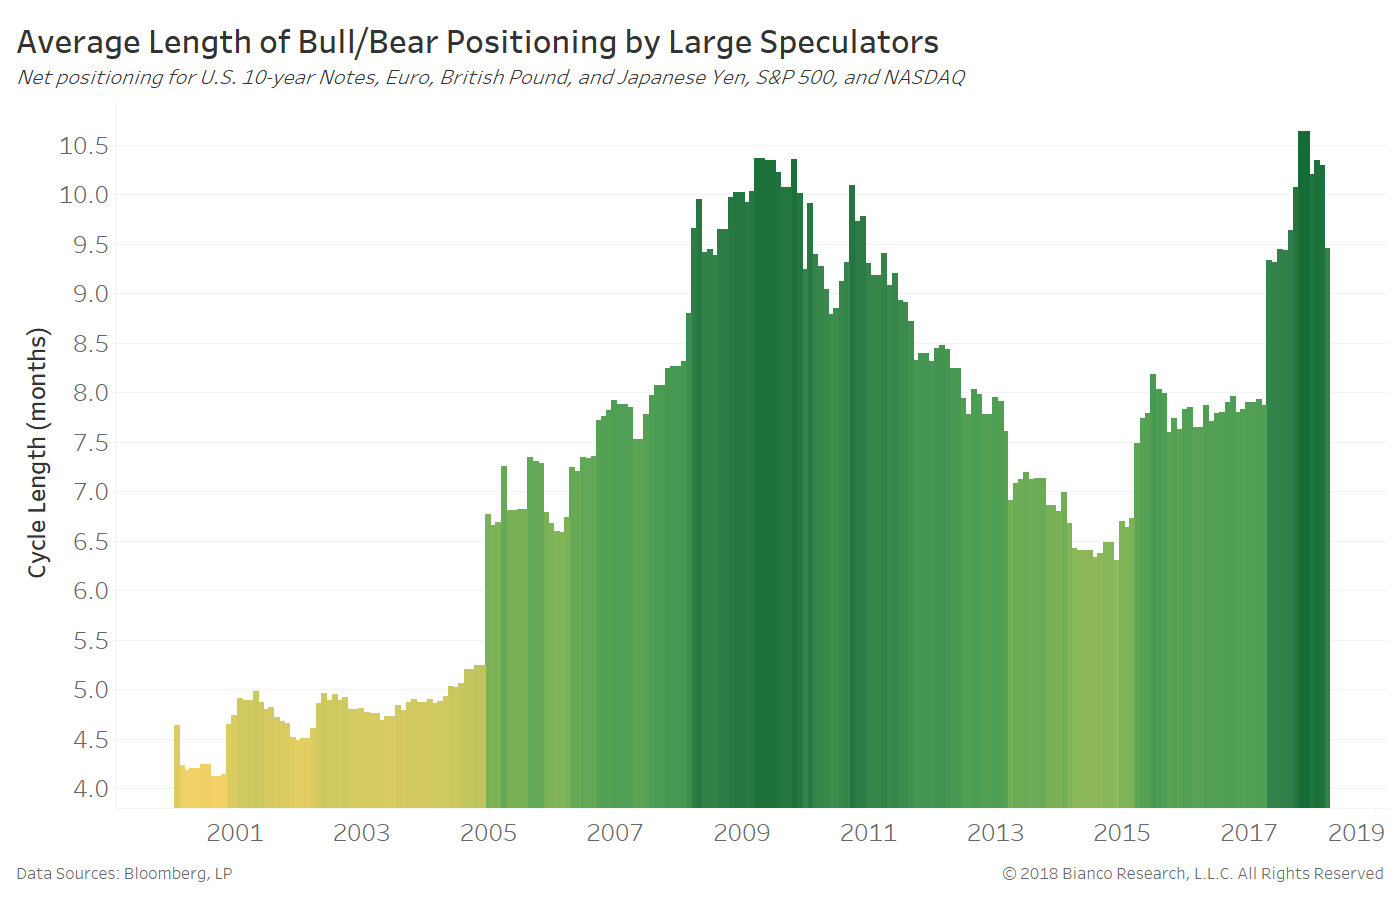
The chart below shows the rolling five-year average length of long and short positioning by large speculators across major investments. Net positioning from the CFTC’s Commitment of Traders report are used to produce long (bullish) and short (bearish) cycle lengths for U.S. 10-year notes, euro, pound, yen, S&P 500, and NASDAQ.
Speculators maintained bullish or bearish positioning for significantly longer periods of time heading into the financial crisis. The length of these cycles move higher from near five months to well-over 10 months by 2009. A new high in these cycle lengths was achieved in late 2017 at over 10.5 months. Speculators are operating like ocean fish in large schools, choosing long or short positioning in concert.
Surveys for economic growth and inflation are likely plagued by this same phenomenon. The advent of the internet and instantaneous news caused a sea change in the mid-to-late 1990s. We noted last week the ending of ISM Prices Paid Index as a predictive indicator near this same period.
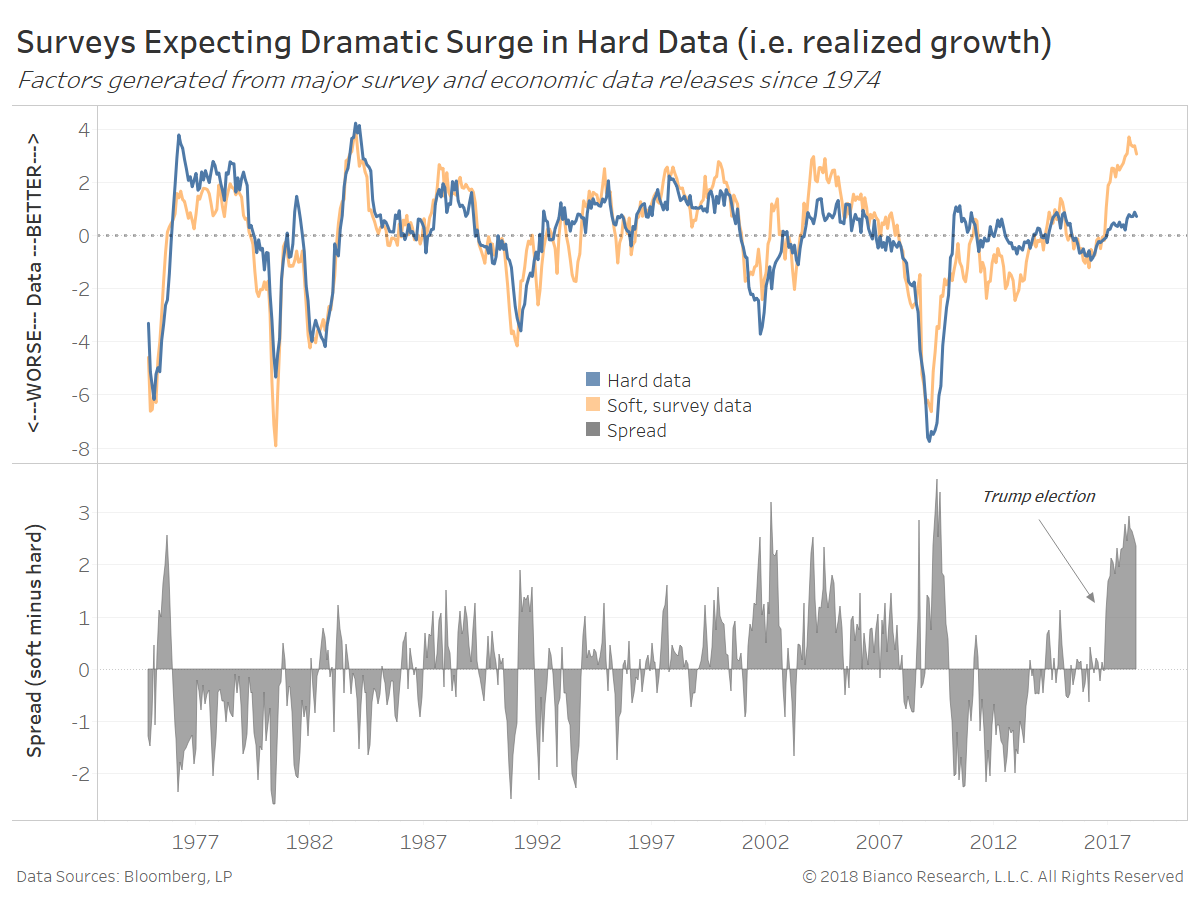
The chart below shows U.S. soft (peach) and hard (blue) data since 1974 in the top panel with their spread in the bottom panel. The story of soft, survey-based data greatly exceeding hard, realized data has not left us. Trump’s election has generated the largest acceleration of rosy survey responses relative to actual economic conditions away from the end of a recession.
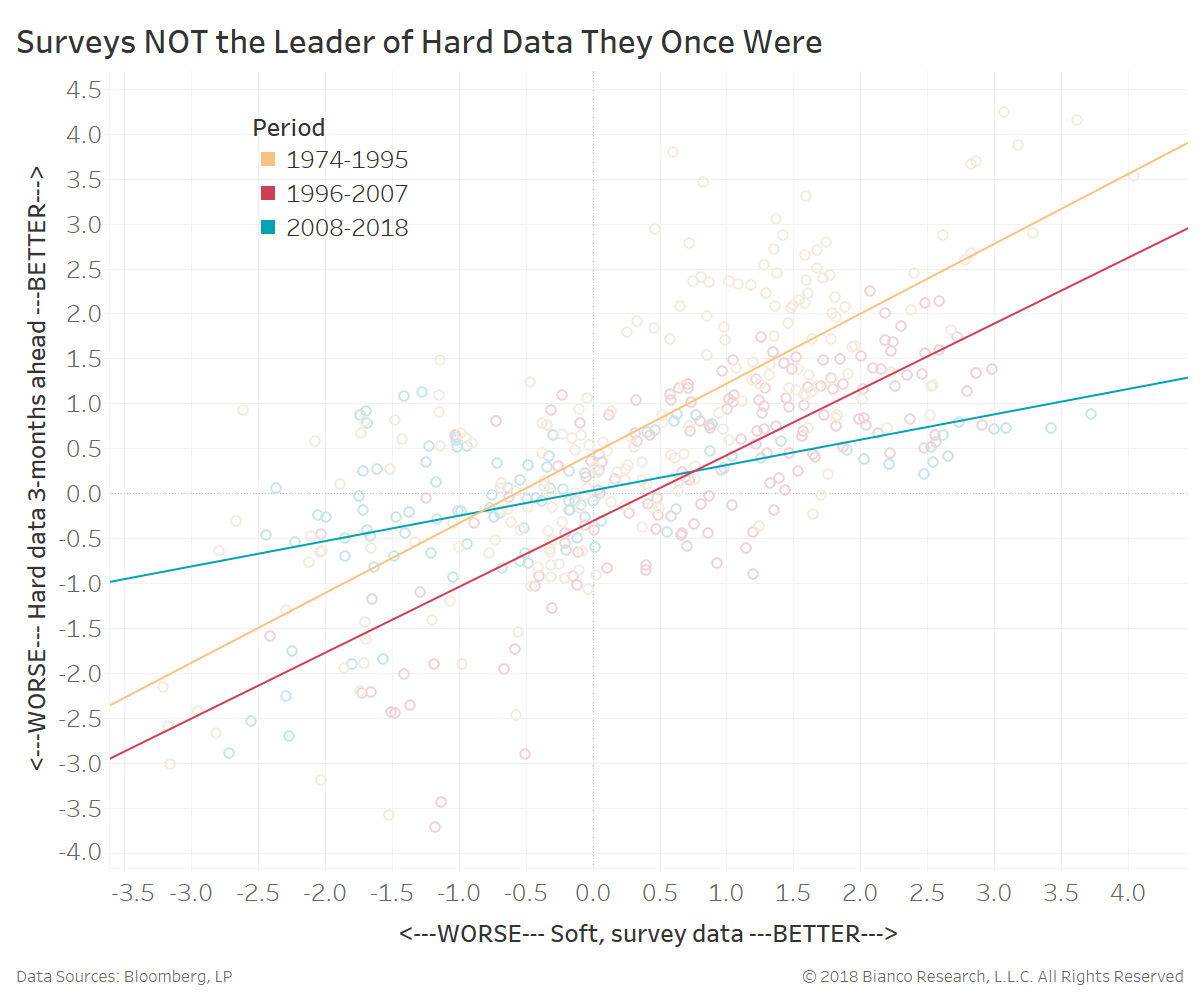
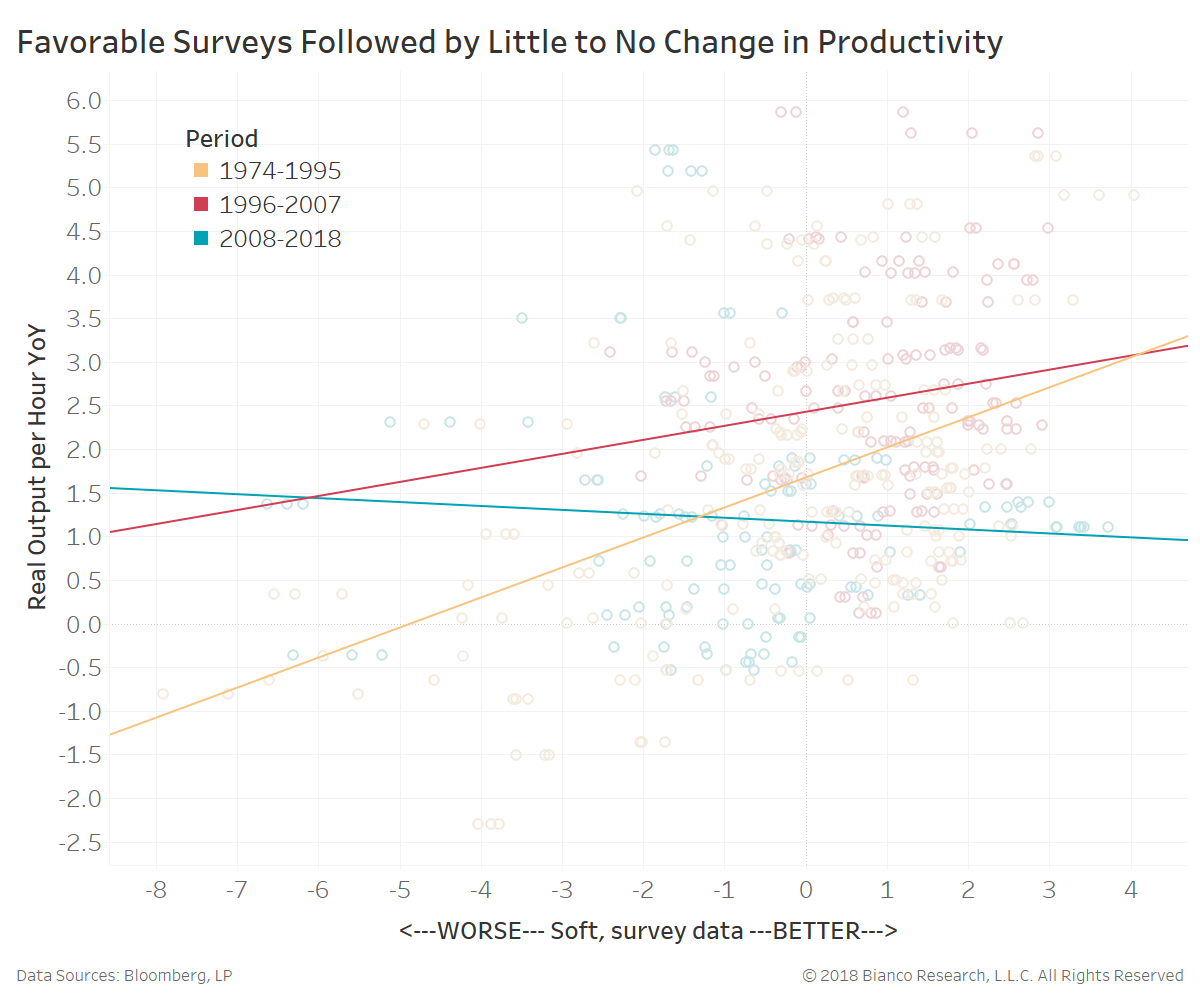
But, we have a problem in surveys failing to accurately predict coming economic growth and inflation. The next chart shows the composite of soft, survey data (x-axis) versus hard economic data three-months ahead (y-axis). In other words, how well do surveys predict the next quarter’s realized economic growth?
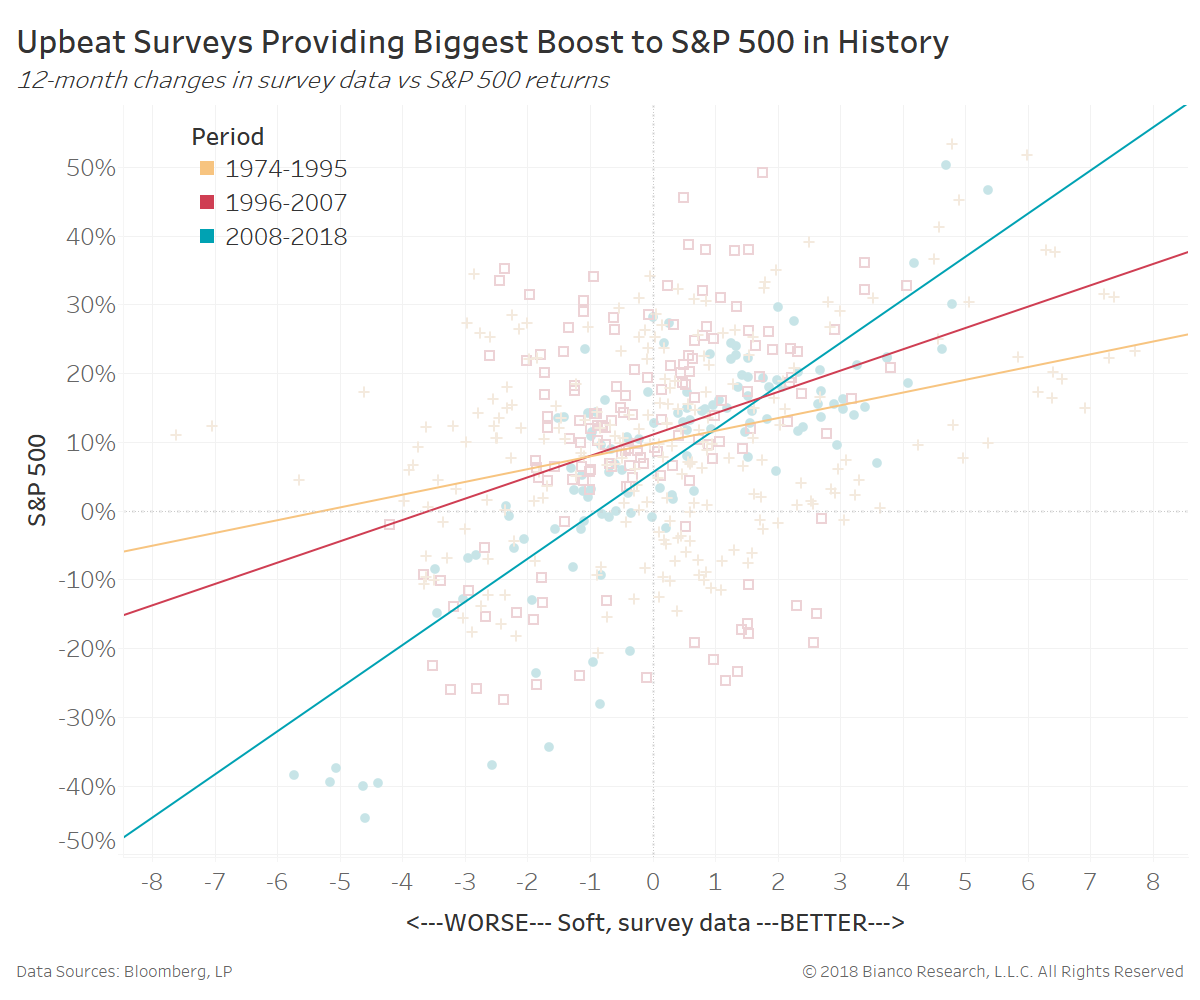
Bullish surveys for the economy have seen less and less realized improvements over time. Their relationship since 2008 has been tepid at best.
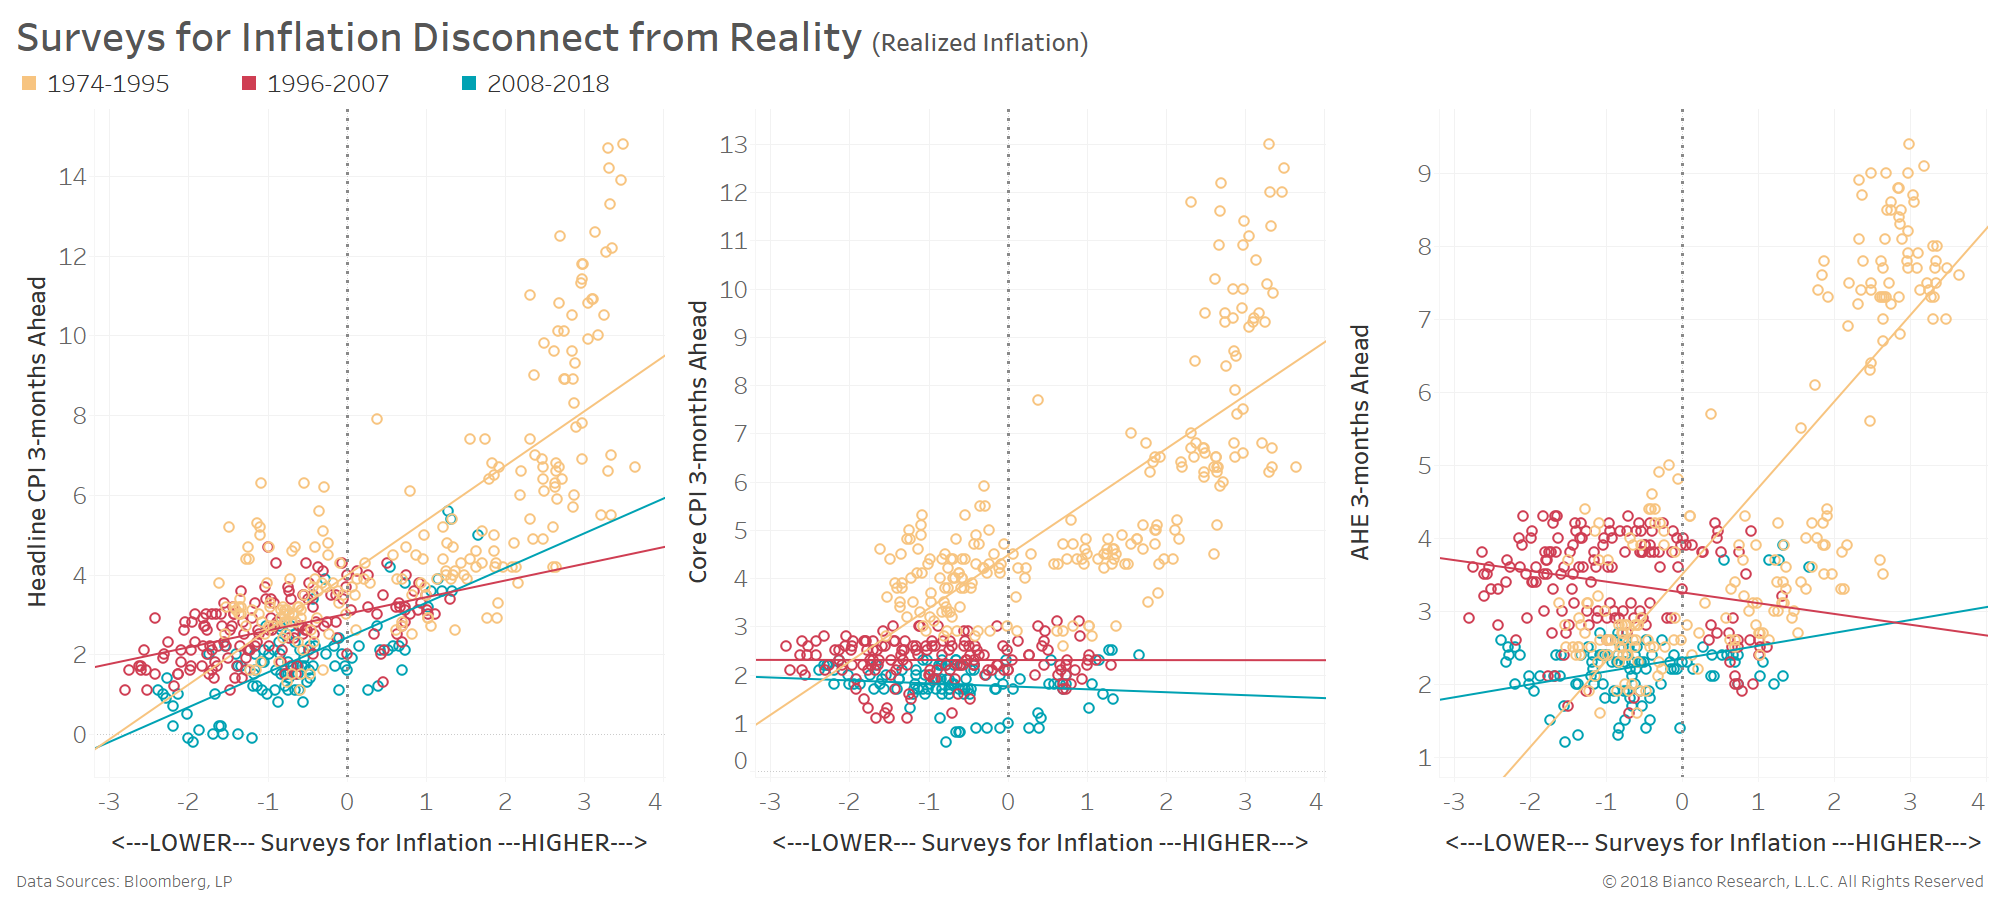
Most important for the Federal Reserve, surveys for rising prices and wages are offering little-to-no utility in forecasting realized inflation. The next set of charts show the same composite of soft, survey data (x-axis) versus headline CPI, core CPI, and average hourly earnings (AHE) three months ahead.
We would expect a parallel shift lower (meaning same slope) if the issue was simply a lower natural rate of growth. But, the slopes have dampened and/or changed their sign (positive to negative).
Core inflation and wages are refusing to chase surveys higher. The ISM, NFIB small business, and regional Fed surveys anticipating swift rises in inflation may have truly disconnected from reality. The relationship of better surveys leading to inflation existed prior to the mid-1990s, but has since faded. The Fed has professed these very surveys are favored predictors. We fear these guides may now be false prophets.
Bottom line:
- Speculators are impaired by herd effect with long/short positioning in major asset classes lasting 10+ months.
- U.S. equities (S&P 500) are chasing rosy surveys of economic growth to a degree not seen in decades past.
- Inflation has been disconnected from surveys for rising prices/wages since the mid-1990s.