Earnings
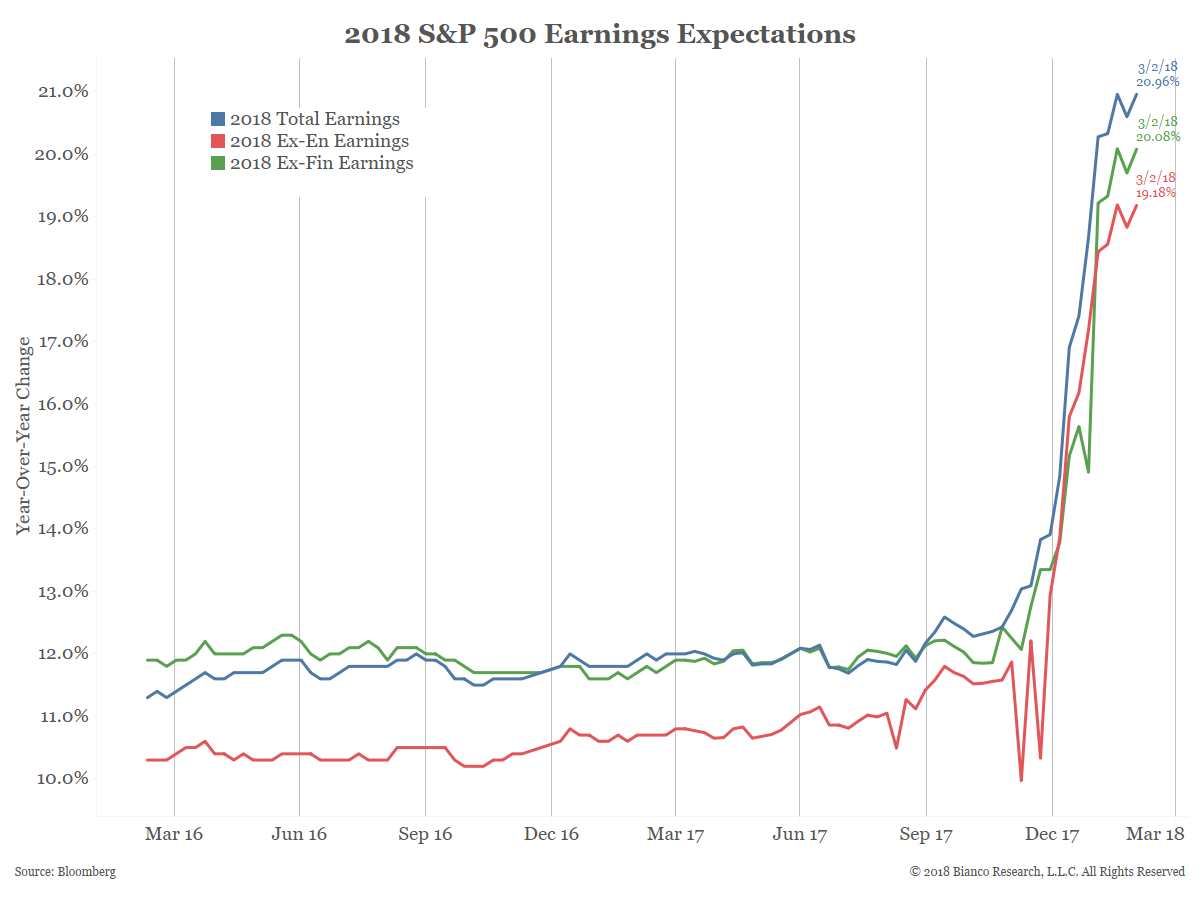
The blue line in the next chart shows earnings growth expectations for all of 2018 are almost 21%. Post-tax bill passage this metric has gone vertical.
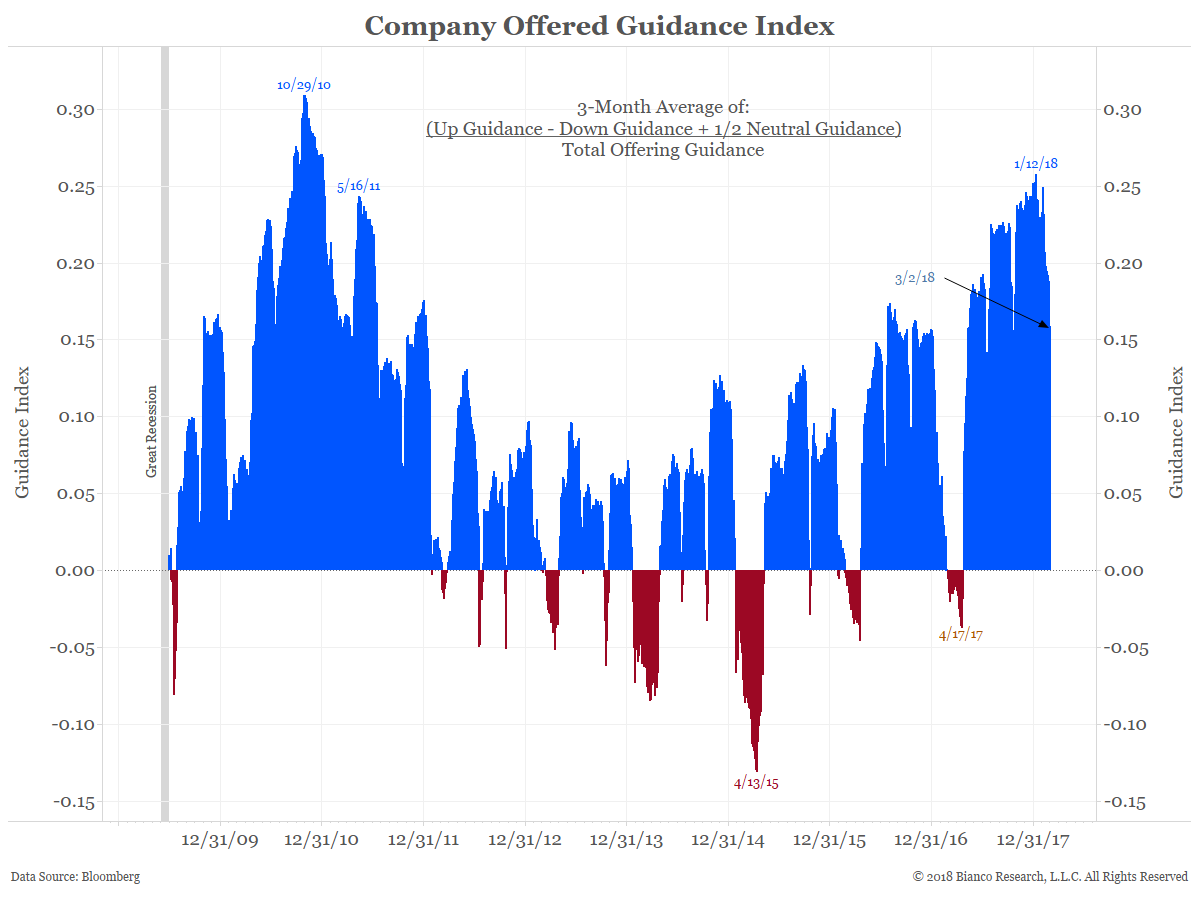
Finally, companies continue to be optimistic about the future. The next chart, which highlights the Guidance Index, shows companies are still offering guidance just off their most positive level in 8 years. But note that our metric is a three-month rolling sum. Two weeks ago FactSet noted the following about 2018 guidance:
Revenues Booming Like Earnings
The next set of charts show S&P 500 revenues or sales. The fact that these are also so strong indicate the growth seen in earnings is not just about the tax cuts.
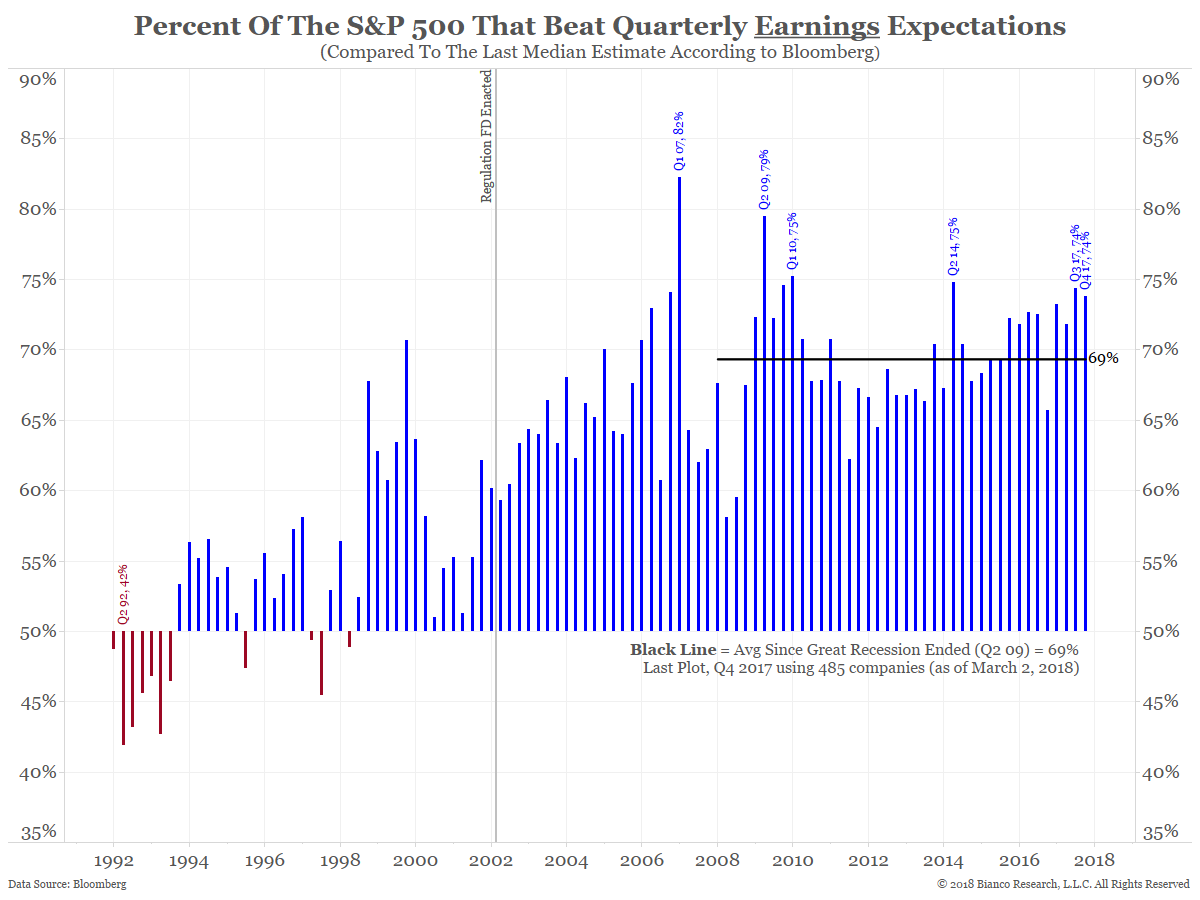
The chart below shows 65% of the 484 companies in the S&P 500 that have reported through Friday, March 2 beat expectations. If this rate holds as the final 16 companies report, it will be the highest beat rate in the post-crisis era.
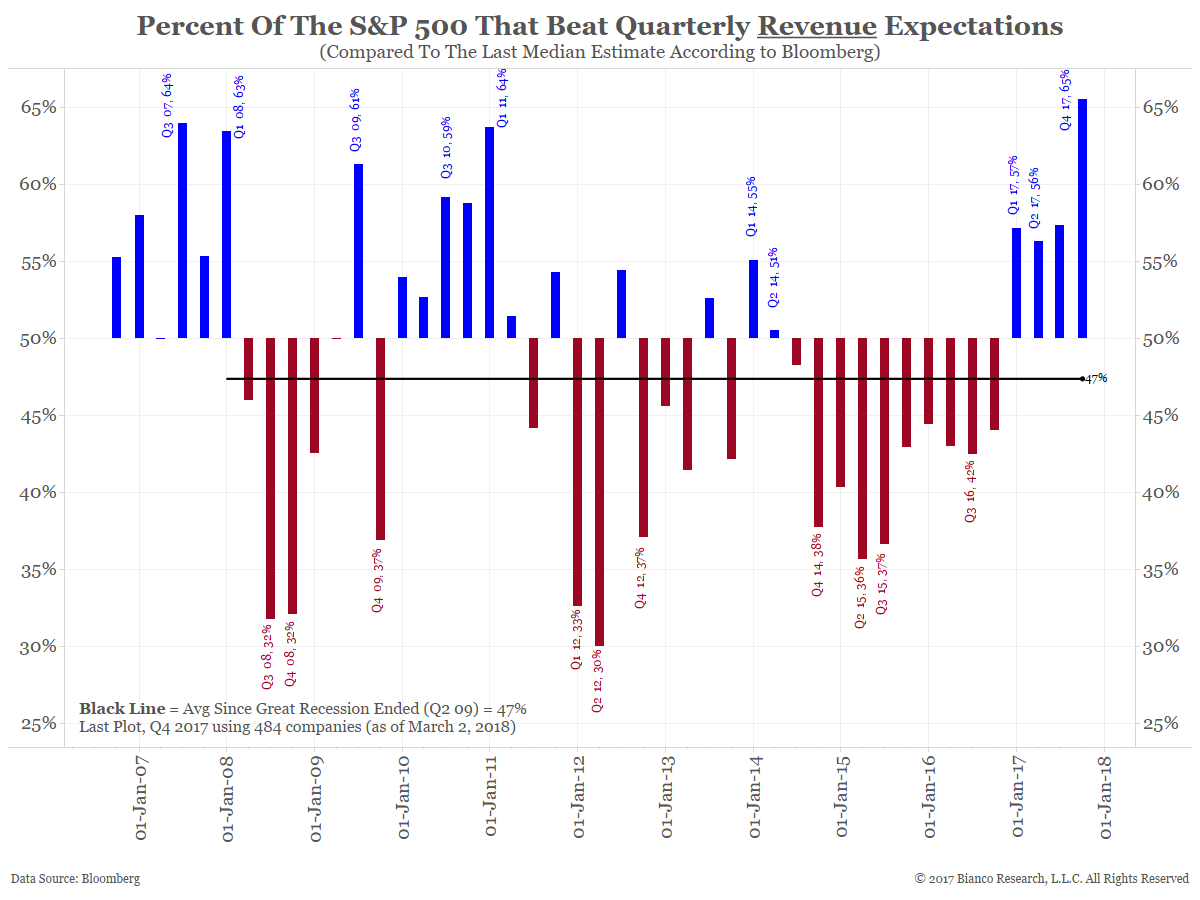

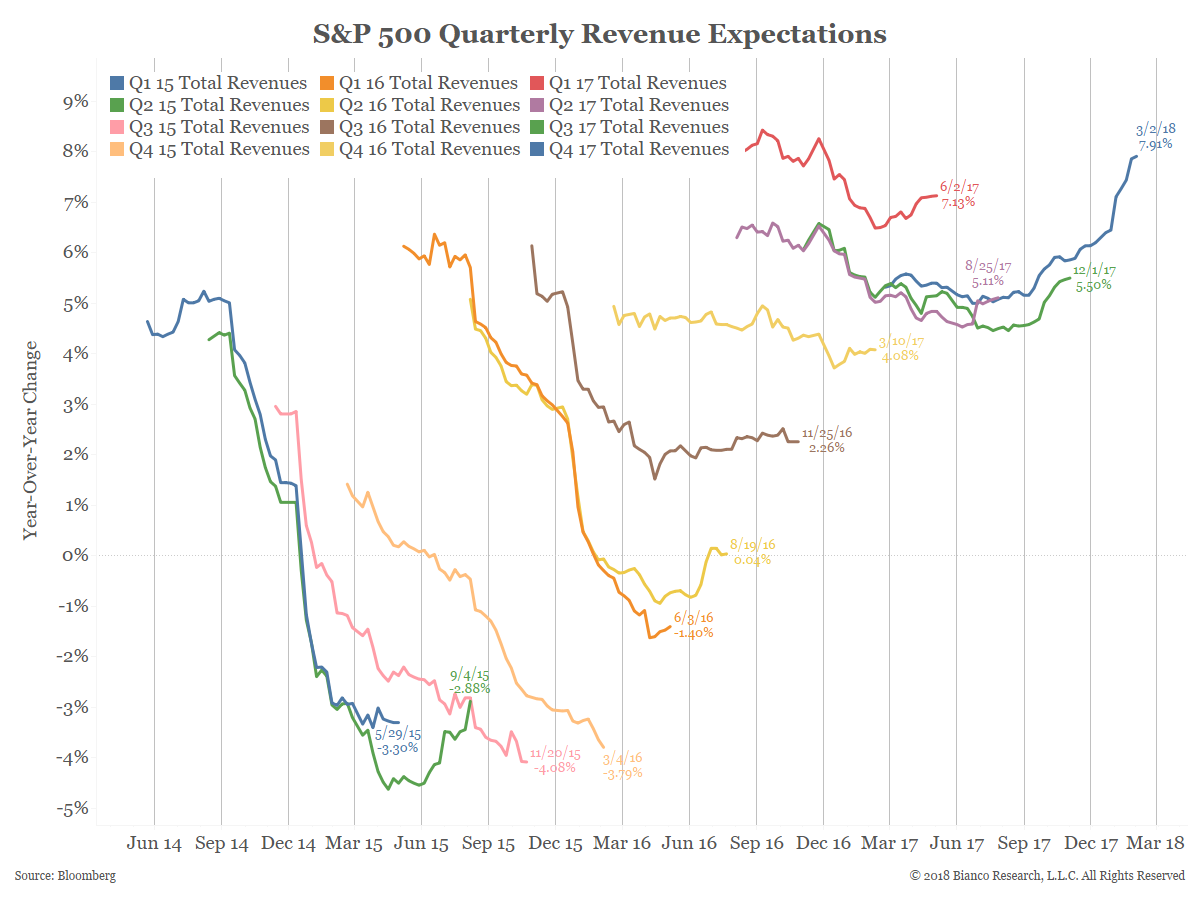
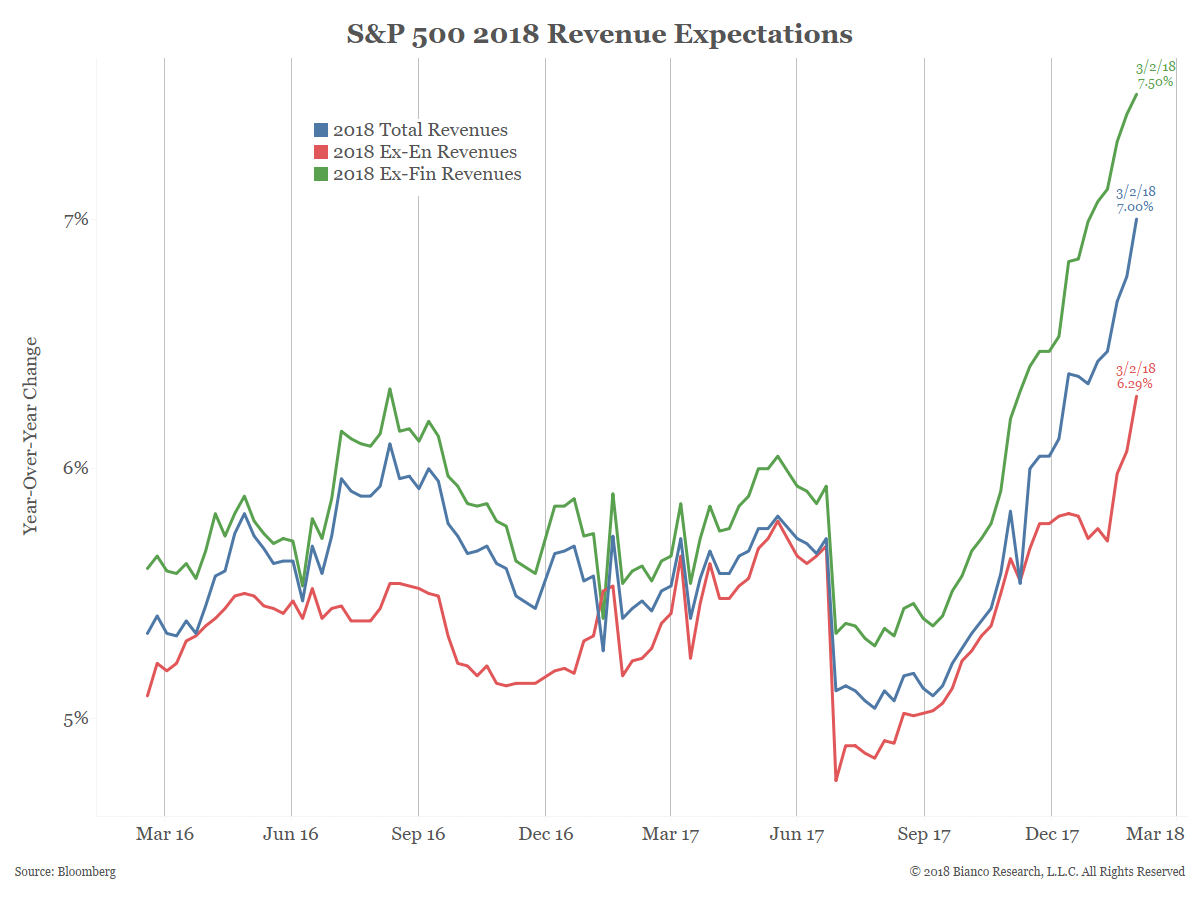
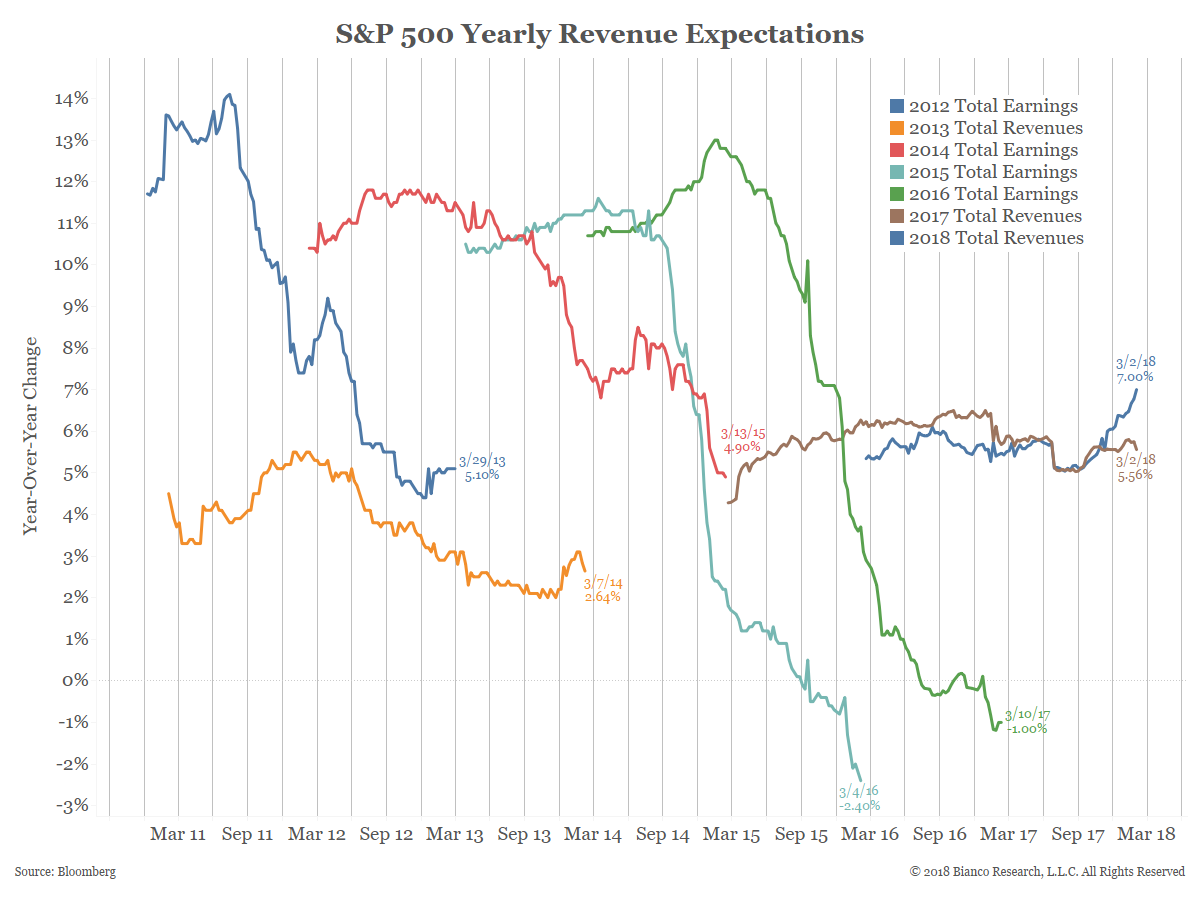
As the right-most blue line in the chart below shows, 2018 revenue expectations are the highest in the post-crisis period.
Earnings are being driven by an expectation of a surge in revenues as much they are by the new tax code.