- Bloomberg – With Rates on the Rise, Bond Proxy Stocks Turn Into Problem Children
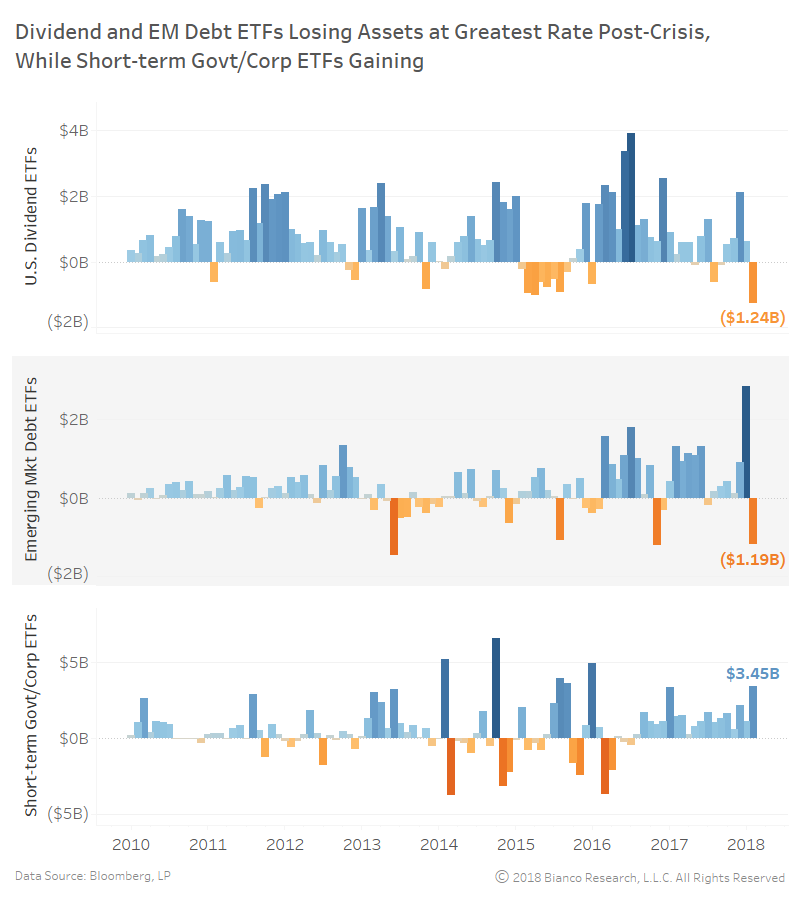
ETFs tracking dividend payers see biggest outflow since 2016
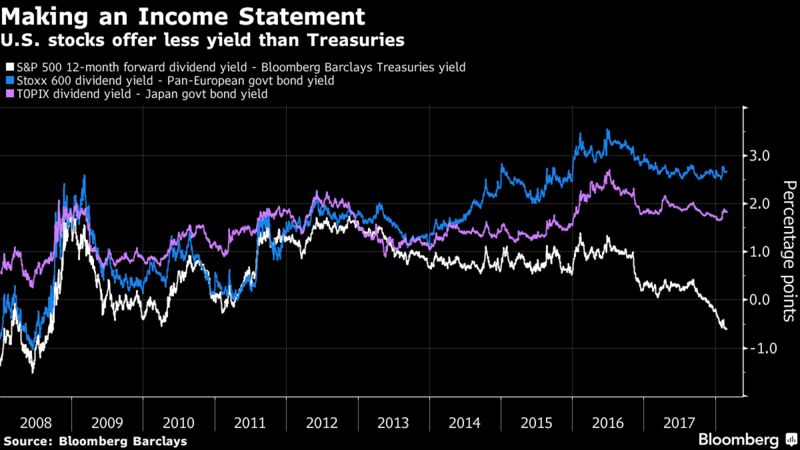
In the years of rock-bottom interest rates, investors piled into a class of stock coveted for its consistent payouts. Now, as the Federal Reserve looks certain to raise rates at least three times this year, the group is trotted out as Exhibit A for why the nine-year bull market might be in danger. Known as bond proxies, they’re the companies that peddle soap, diapers and ready-to-eat food. While they lack the heady price returns notched by high-flying tech and bank shares, they’ve been stalwart in the ability to return cash to investors. Consumer staples, phone and utility companies have the highest dividend yields, a measure of a stock’s price relative to its payout.
Summary
Comment
The chart below shows monthly flows for U.S. high dividend, emerging market debt, and short-term government/corporate ETFs types. Money is pouring out of high dividend and emerging market debt ETFs at a pace not seen post-crisis. Conversely, consistent inflows are being seen in short-term fixed income ETFs.
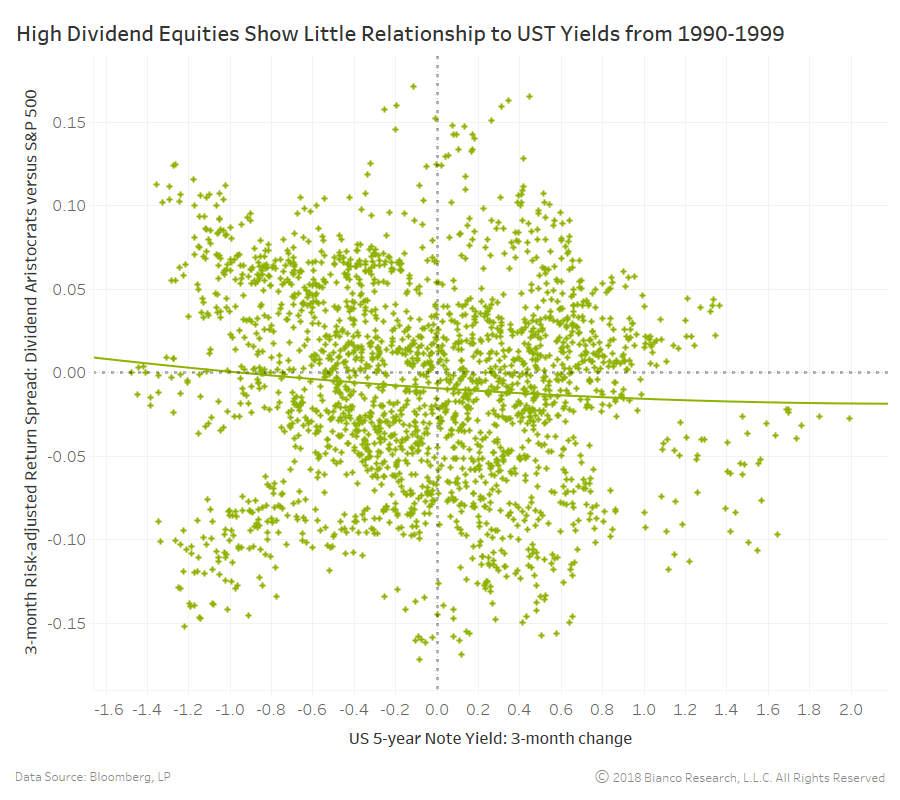
Shifting investor allocations are more a result of changing correlations and hedging concerns than U.S. Treasury yields simply rising above dividend yields offered by equities.
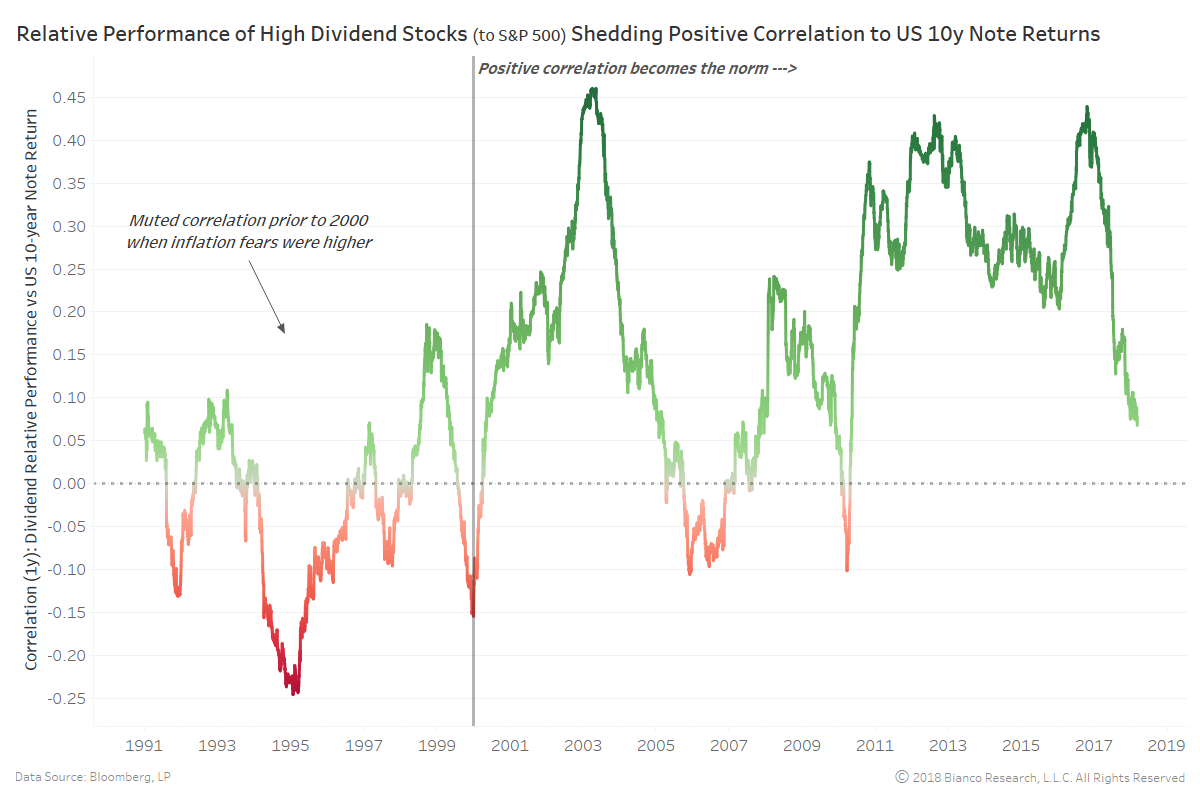
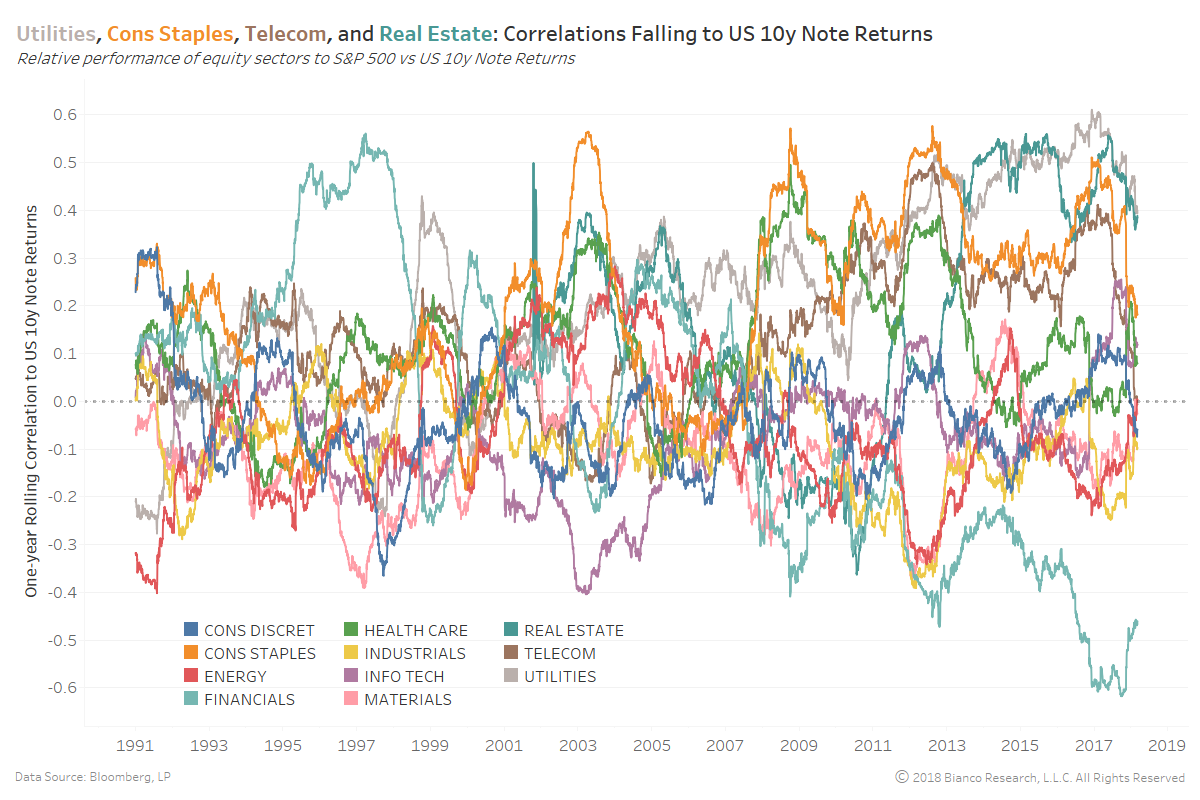
Additionally, investors are shifting assets between equity sectors based on the difficulty to hedge risks with safe assets. The chart below shows the rolling one-year correlation between relative equity sector performance to the S&P 500 and U.S. 10-year note returns.
Sectors like utilities, consumer staples, telecom, and real estate are all seeing correlations to U.S. 10-year note returns quicken their decline since December 2017. Not surprisingly, TIPS breakevens (i.e. inflation expectations) began to significantly widen over this same period.
All in all, investor strategies and algorithms will likely undergo a period of transition and re-writing as a new regime takes hold.