- Bloomberg – From Inflation to Tax Cuts, One U.S. Report Has It All Thursday
January spending, income data to get more attention than usual
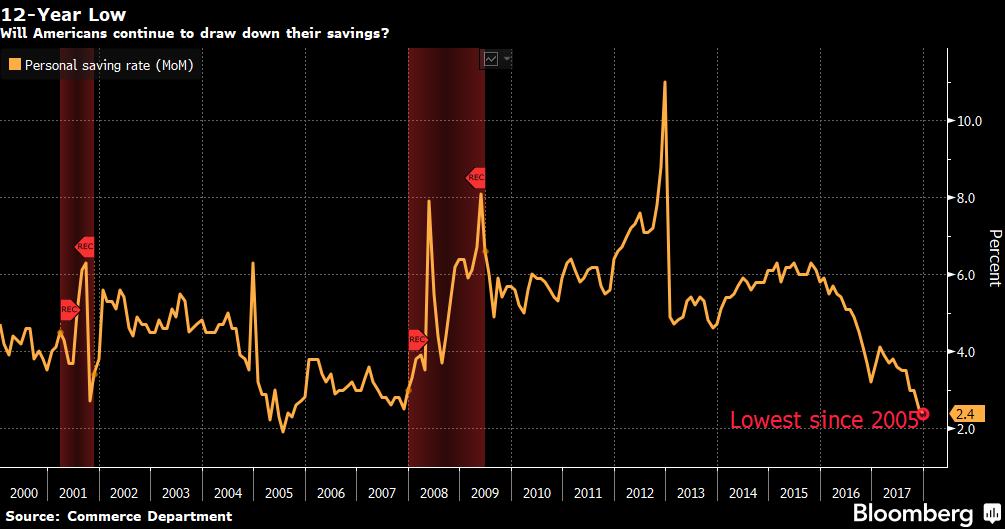
Early hints on how tax cuts are boosting the U.S. economy. New signs of how price pressures are flowing into a key inflation metric. An update on America’s low, low saving rate. And, above all, how consumer spending is holding up. Welcome to Thursday’s report on personal income and spending from the Commerce Department. The January figures may garner more attention than usual because they’ll cover the first month since the tax-cut legislation was signed and will provide the final reading on the Federal Reserve’s preferred price gauge before March meeting on interest rates.
Summary
Comment
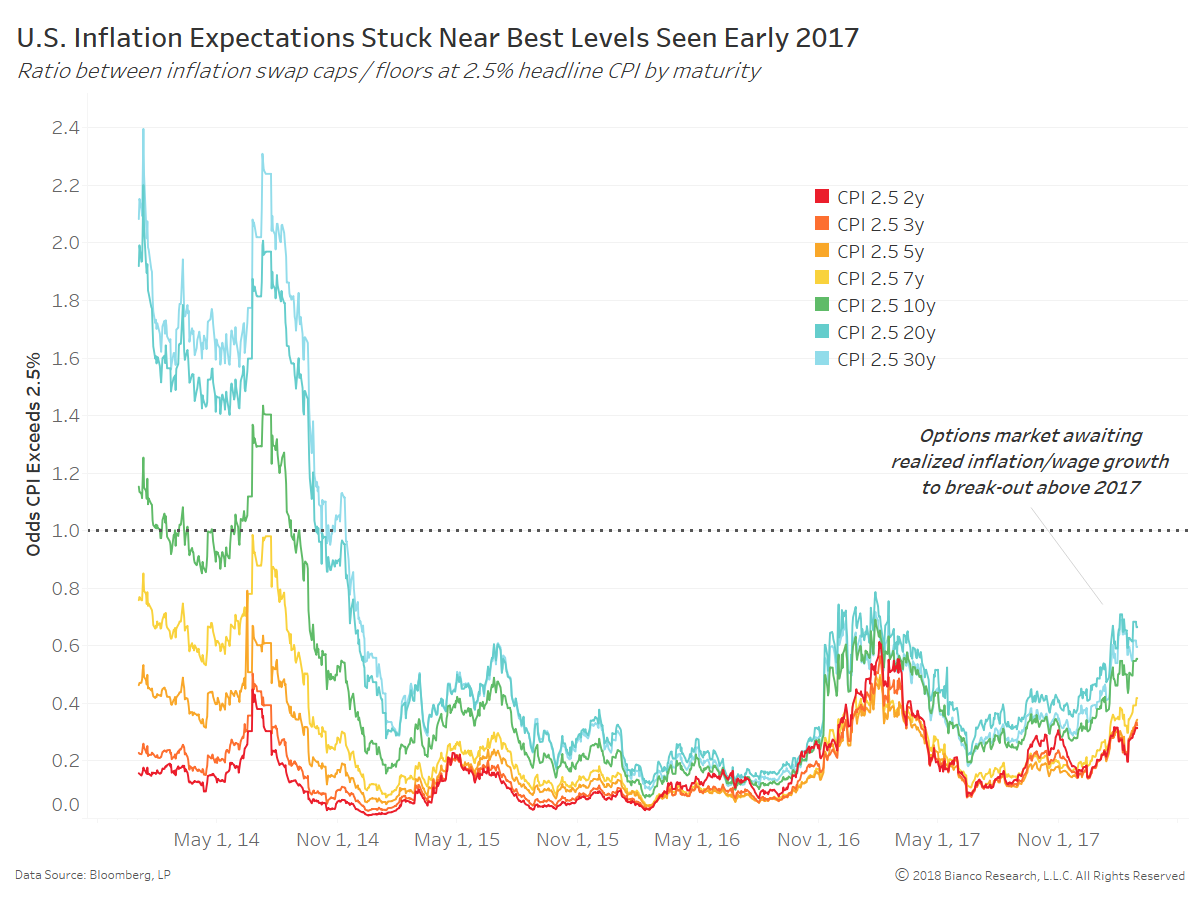
Tomorrow (March 1st, 2018) could be a pivotal day for financial markets paying extra close attention to inflation and wage growth. A bummer retail sales to begin the year (less autos and gas expected at -0.2%) have many on edge. Personal income and spending data will offer the first glimpse of the tax plan’s impact on the consumer.
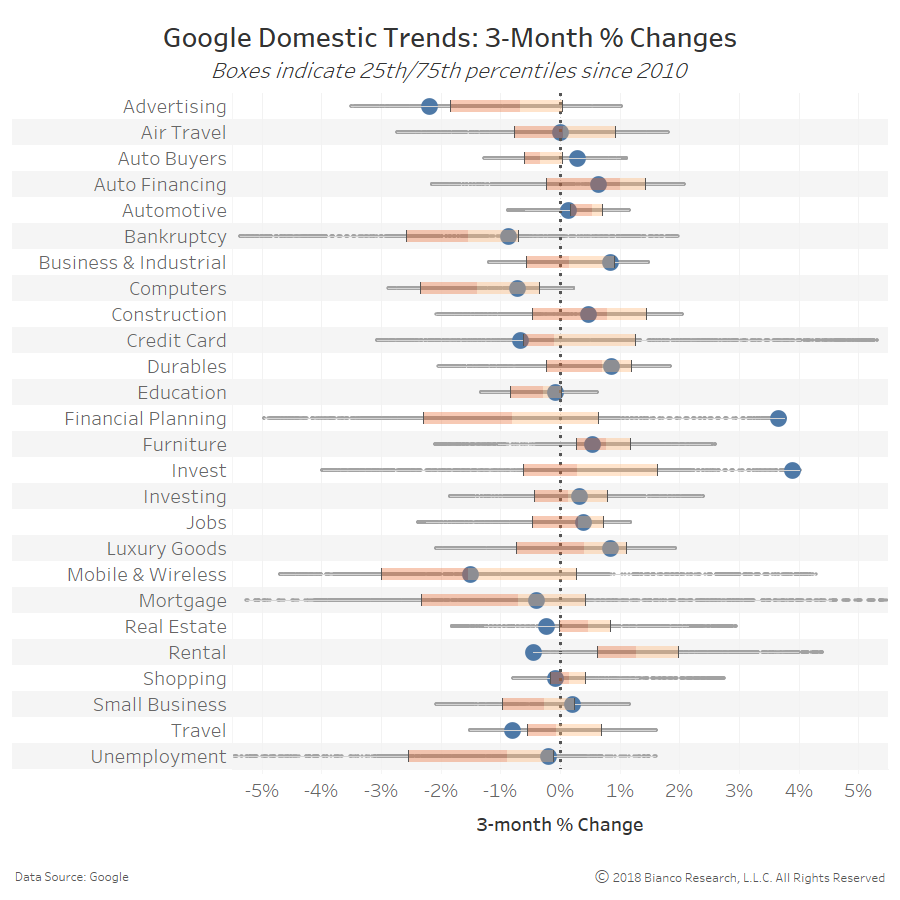
The chart below shows three-month changes in Google Domestic Trends with current as blue dots, ranges since 2010 as gray dots, and the 25th/75th percentiles as orange boxes. Google Domestic Trends offer very useful insight into the biases and convictions of consumers and businesses via their Google search traffic.
Many trends have abated since our last update in December 2017. Key takeaways:
- Auto buying and financing have fallen below average after very strong interest to close 2017
- Financial planning and investing have grown appreciably, even while the savings rate falls
- Real estate has fallen below its 25th percentile
- Non-discretionary purchases like shopping, luxury goods, and travel have slowed to begin 2018
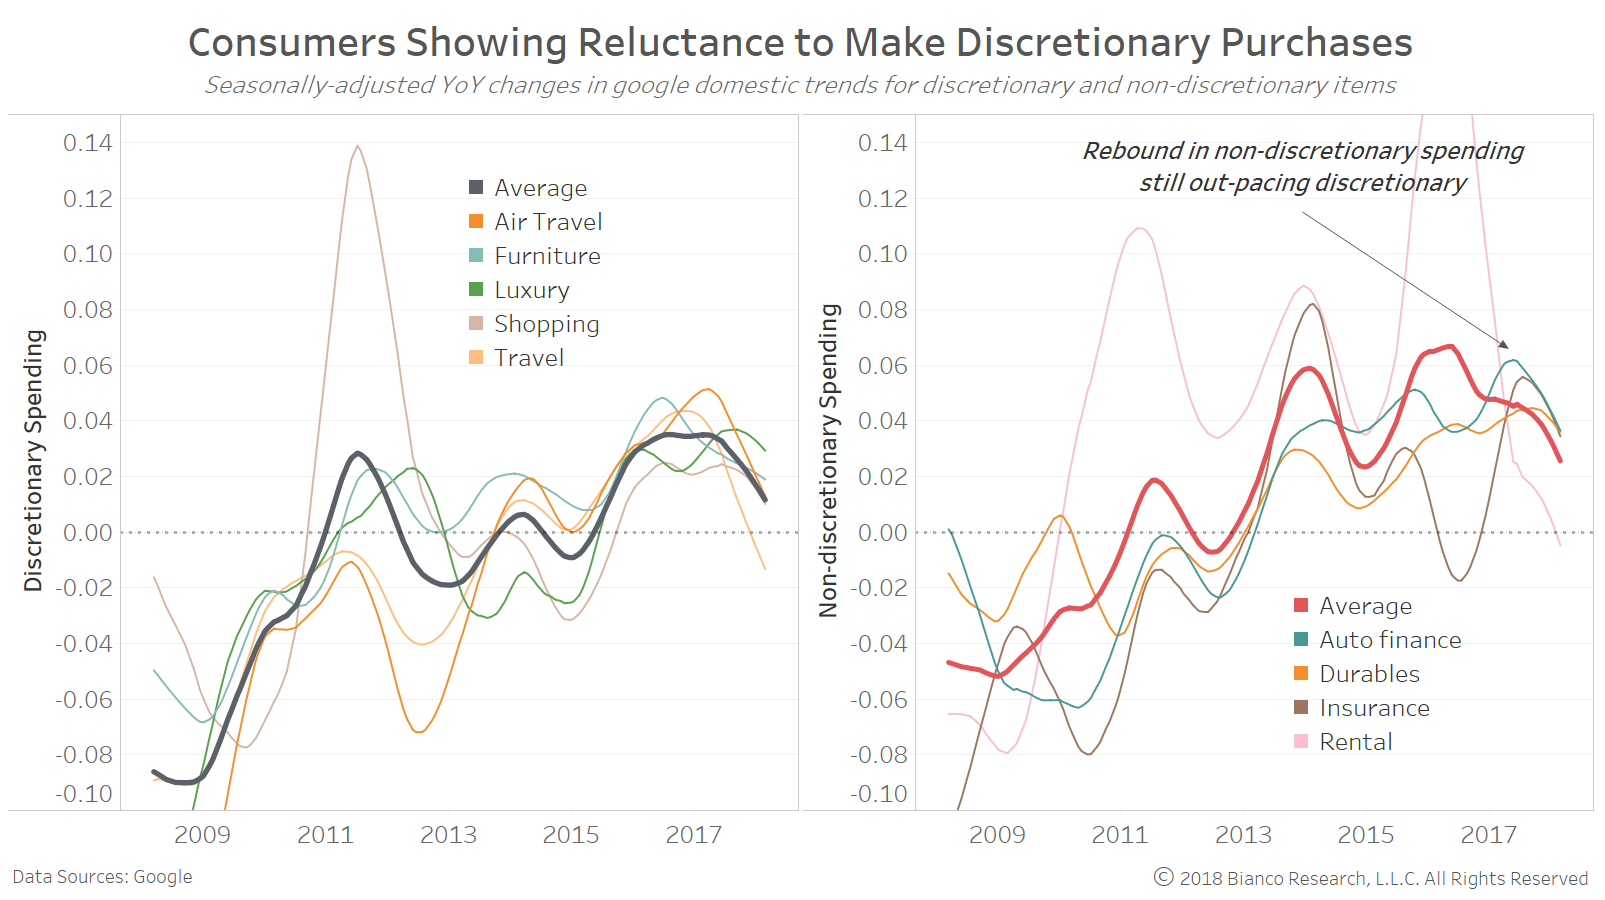
The left panel in the chart below shows seasonally-adjusted year-over-year changes in Google search trends attributed to discretionary spending. The right panel shows the same, but for non-discretionary spending. The average growth of non-discretionary spending (red) remains above discretionary (black).
Unfortunately, growth in search trends for both discretionary and non-discretionary items are slowing since peaking mid-2016.
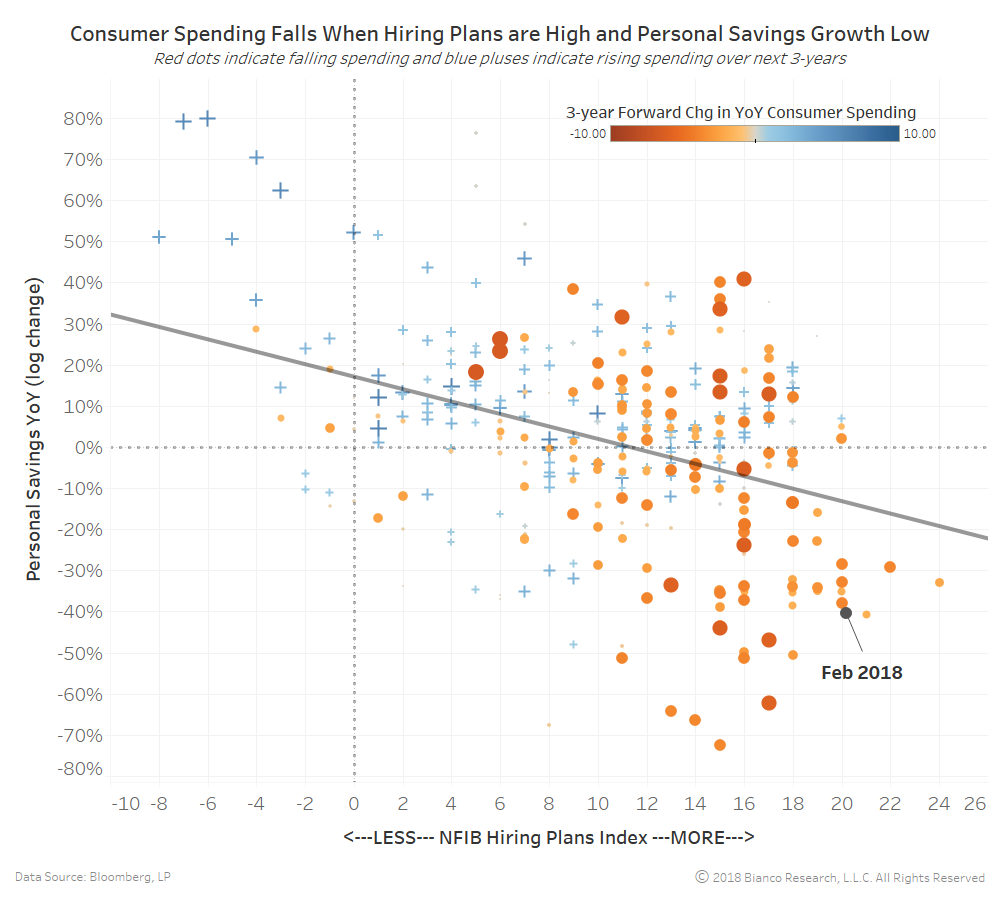
The chart below shows the NFIB’s Hiring Plans Index on the x-axis versus the year-over-year log change in the U.S. personal savings rate. The size and color of each instance indicate the change in year-over-year consumer spending over the following three years. Larger, darker red dots indicate consumer spending has fallen in the following three years.
The current rosy outlook for hiring coupled with a drop in the personal savings rate has historically been met with lower consumer spending.
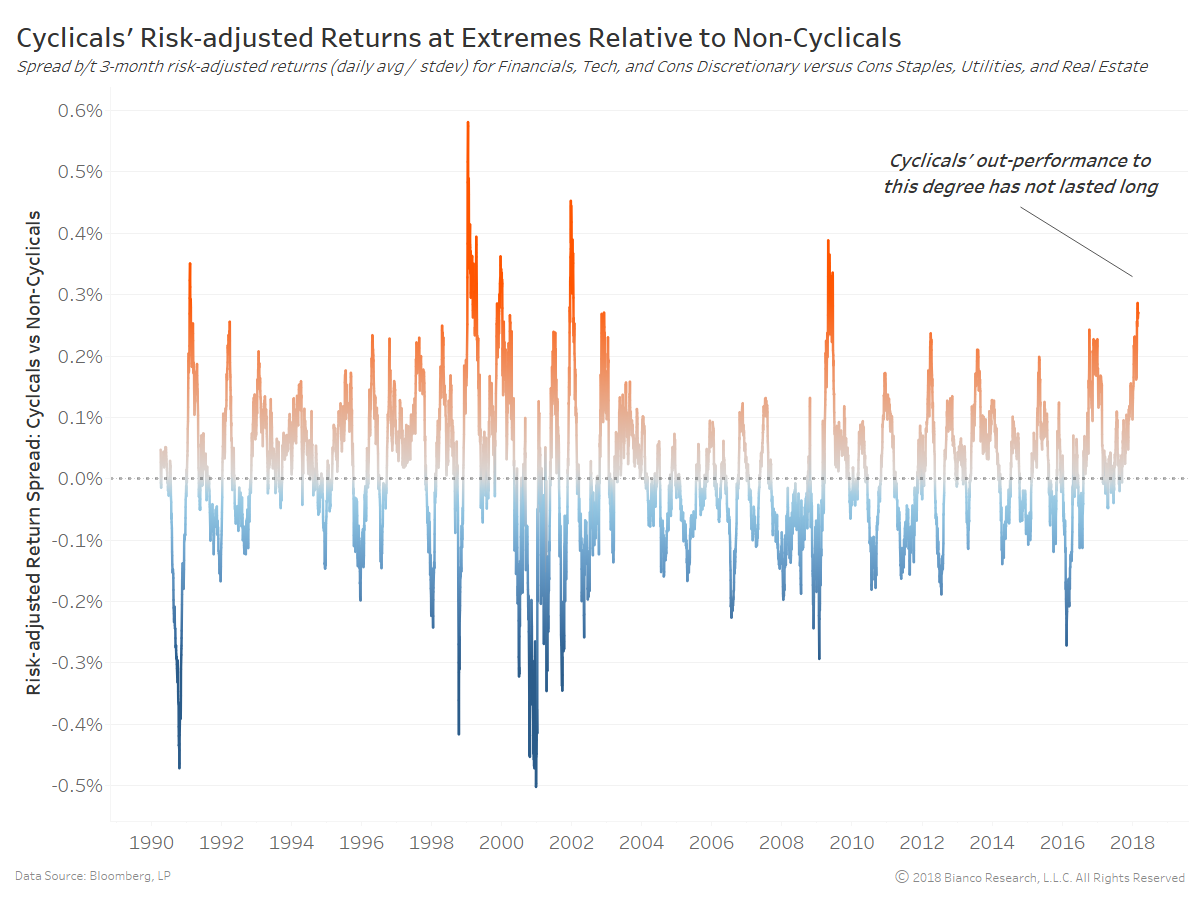
We continue to favor over-weighting defensive sectors and municipal bonds given softening consumer trends and ‘as good as it gets’ economic growth. The last chart below shows the spread between risk-adjusted returns (three-month) for financials, technology, and consumer discretionary versus consumer staples, utilities, and real estate.
Heightened fears of inflation and higher U.S. Treasury yields have caused a significant divergence between cyclical and non-cyclical equity sectors. Such outperformance has historically not been sustainable.