- Tim Duy’s Fed Watch – Moving Pieces
If as I suspect much of what we are seeing in the economy is a cyclical readjustment, then long term yields will likely reach more resistance soon while short term yields will continue to be pressured by Fed rate hikes this year and beyond. If the Fed turns hawkish here they will likely accelerate the inversion of the yield curve and the end of the expansion (this could be the ultimate impact of the tax cuts – a short run boost to a mature cycle that moves forward the recession). If a more secular realignment is underway, long (and short) rates have more room to rise. It is reasonable to be unable to differentiate between these two outcomes as this juncture. - The Financial Times – Anatomy of the escalating bond bear market
With term premia now back to ‘normal’ bonds look better underpinned
In summary, the bond bear market has so far been due to a normalisation of bond term premia, especially the inflation risk premium. With term premia now back to “normal”, bonds look better underpinned than in the recent past. If the bond bear market is to be extended much further on a sustainable basis, something new needs to go wrong in the global economy.
Summary
Comment
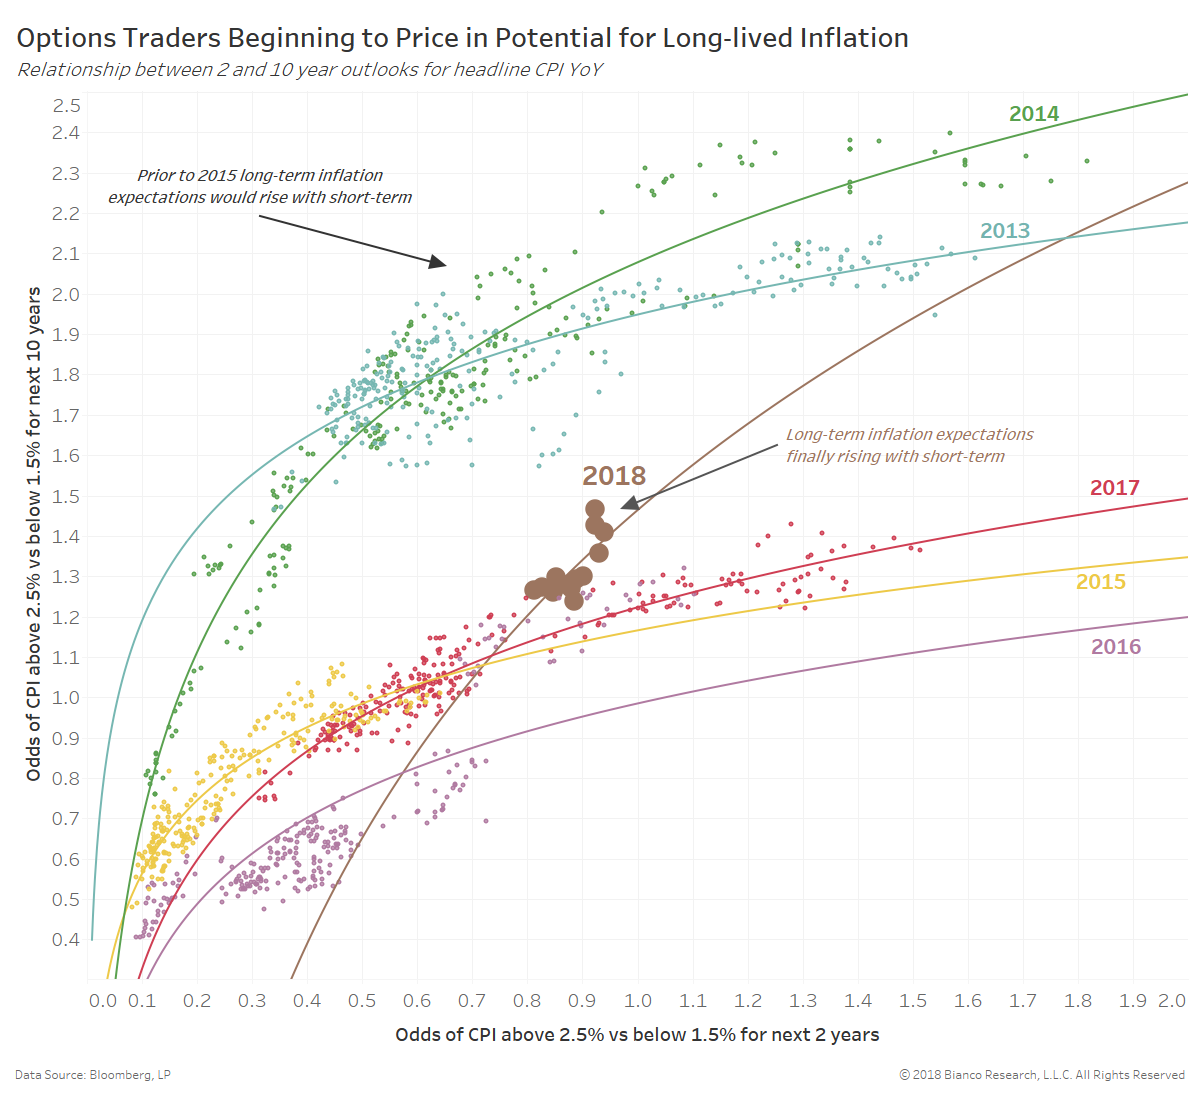
We have stressed risk assets’ recent shift away from a positive correlation relative to inflation expectations for the first time in over a decade. Investors are leaving behind the belief of ‘low inflation forever,’ which we have extensively shown using options on inflation (caps/floors).
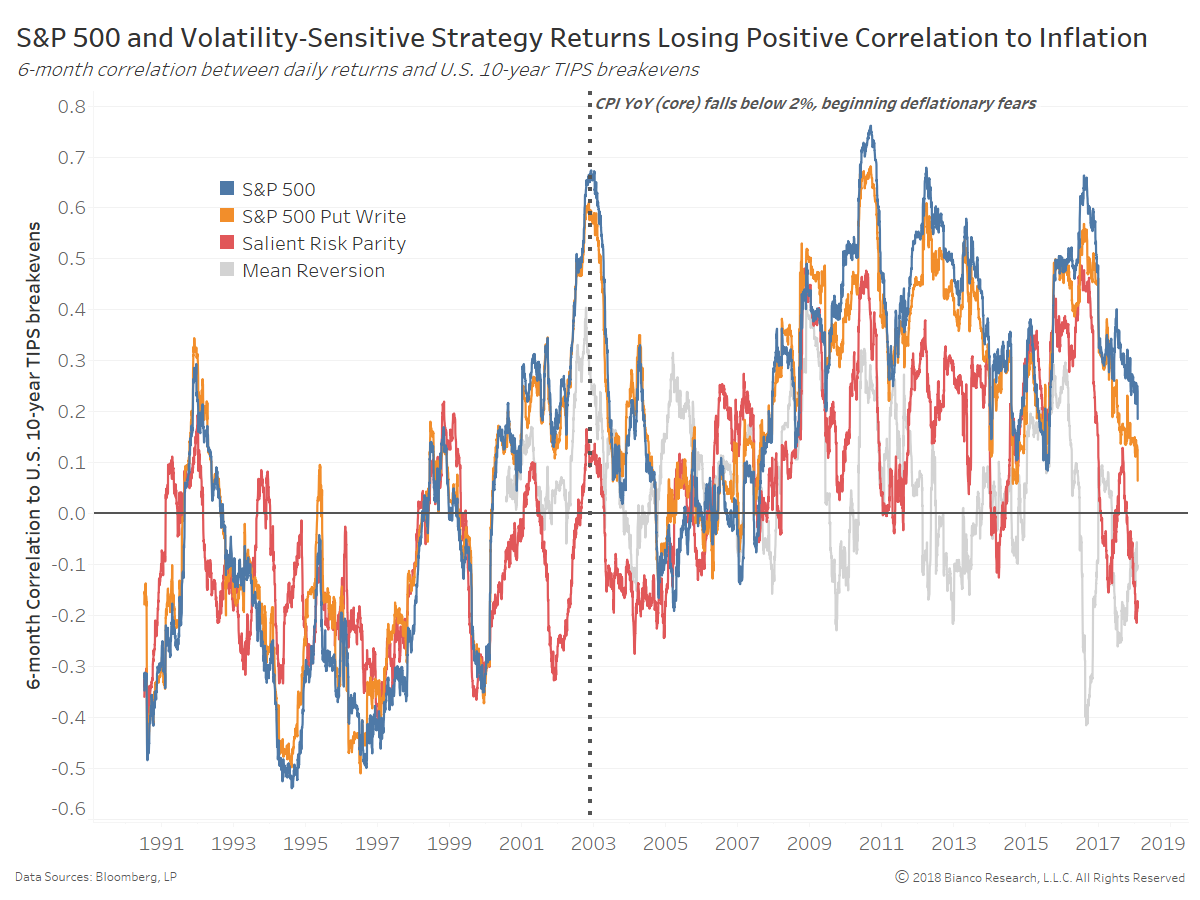
The chart below shows six-month correlations between daily returns by U.S. equity strategies versus U.S. 10-year TIPS breakevens. The S&P 500’s positive relationship to inflation (blue line) is quickly fading with implied volatility (VIX) already signaling an abrupt shift from the post-crisis environment.
Volatility-sensitive strategies like put option writing (orange), risk parity (blue), and mean reversion (gray) are ending their favorable symbiotic relationship with inflation at a faster rate than the S&P 500. The dotted vertical line marks when CPI (core) year-over-year dipped below 2.0%, signaling the beginning of heightened deflationary fears. Notably, risk parity strategies, which we understand vary greatly, are showing negative correlation to inflation akin to pre-2003.
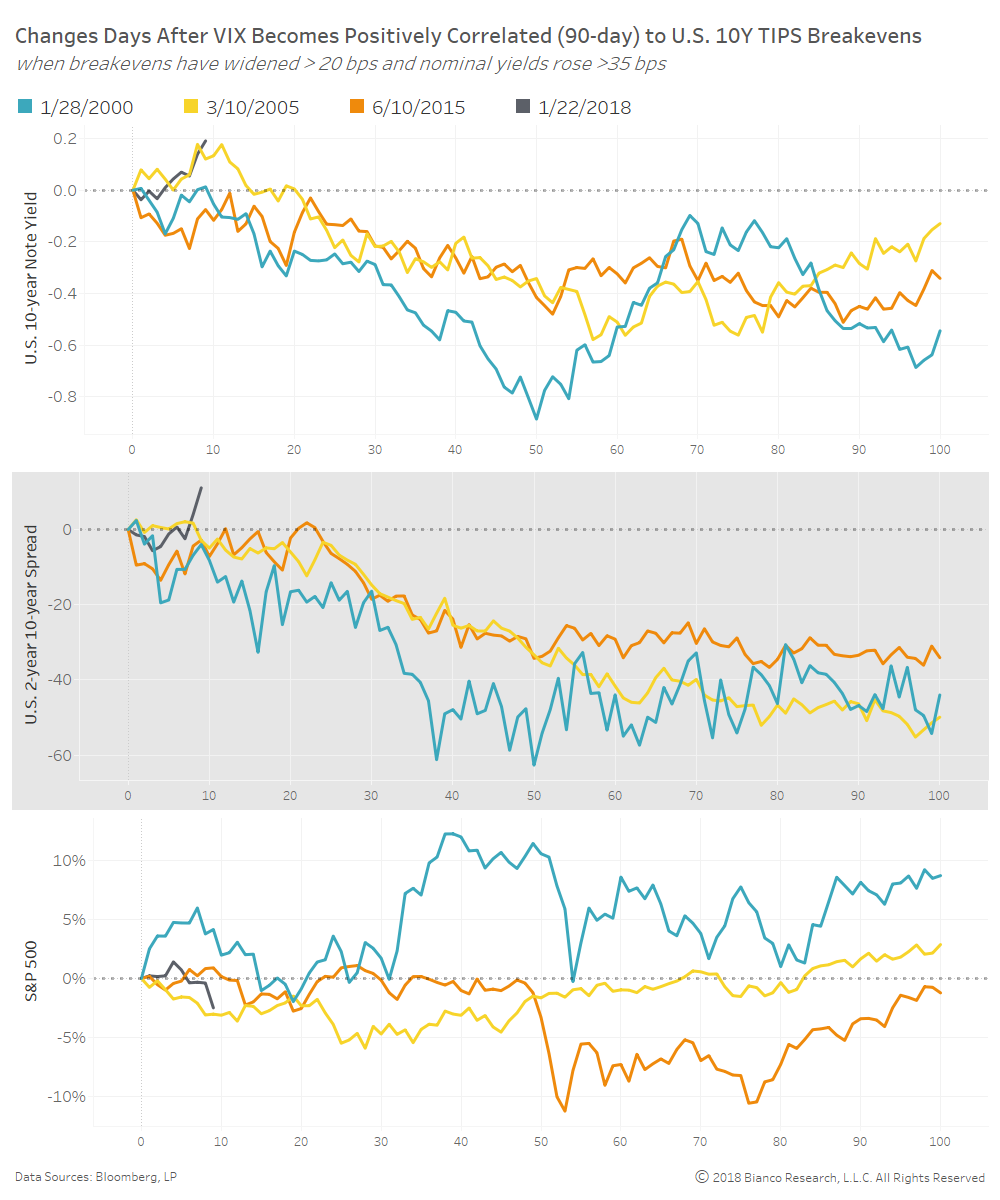
The chart below shows the aftermath of past instances when the VIX and U.S. 10-year TIPS breakevens became positively correlated under similar conditions to 2018. We have shortened the correlation window to 90 days and filtered for instances when TIPS breakevens had widened at least 20 bps and nominal yields rose at least 35 bps over the past three months. In other words, we are searching for environments when inflation induced a rise in U.S. Treasury yields.
The three other instances in January 2000, March 2005, and June 2015 occurred within 6 to 12 months following the beginning of tightening cycles. Note we include balance sheet flow using the Wu-Xia shadow rate when assessing the June 2015 instance.
Historically, U.S. 10-year note yields promptly declined, flattening the yield curve over the following 100 trading days. The S&P 500 saw mixed, sideways trading action. Can the inflation train continue chugging along or will risk-off conditions begin like past instances? We would view a continued rise in yields bucking these historical instances as confirmation of heightened inflation fears.
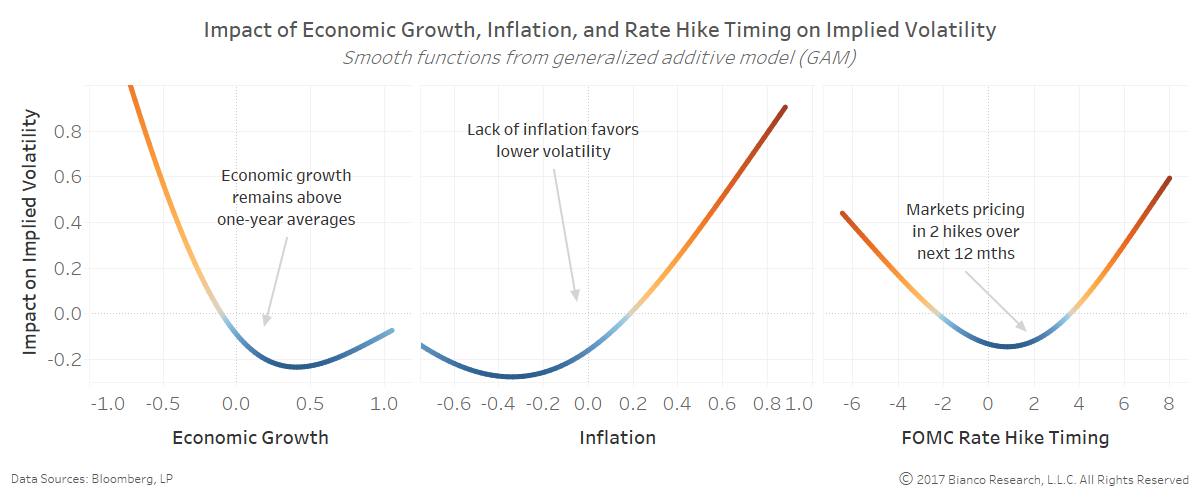
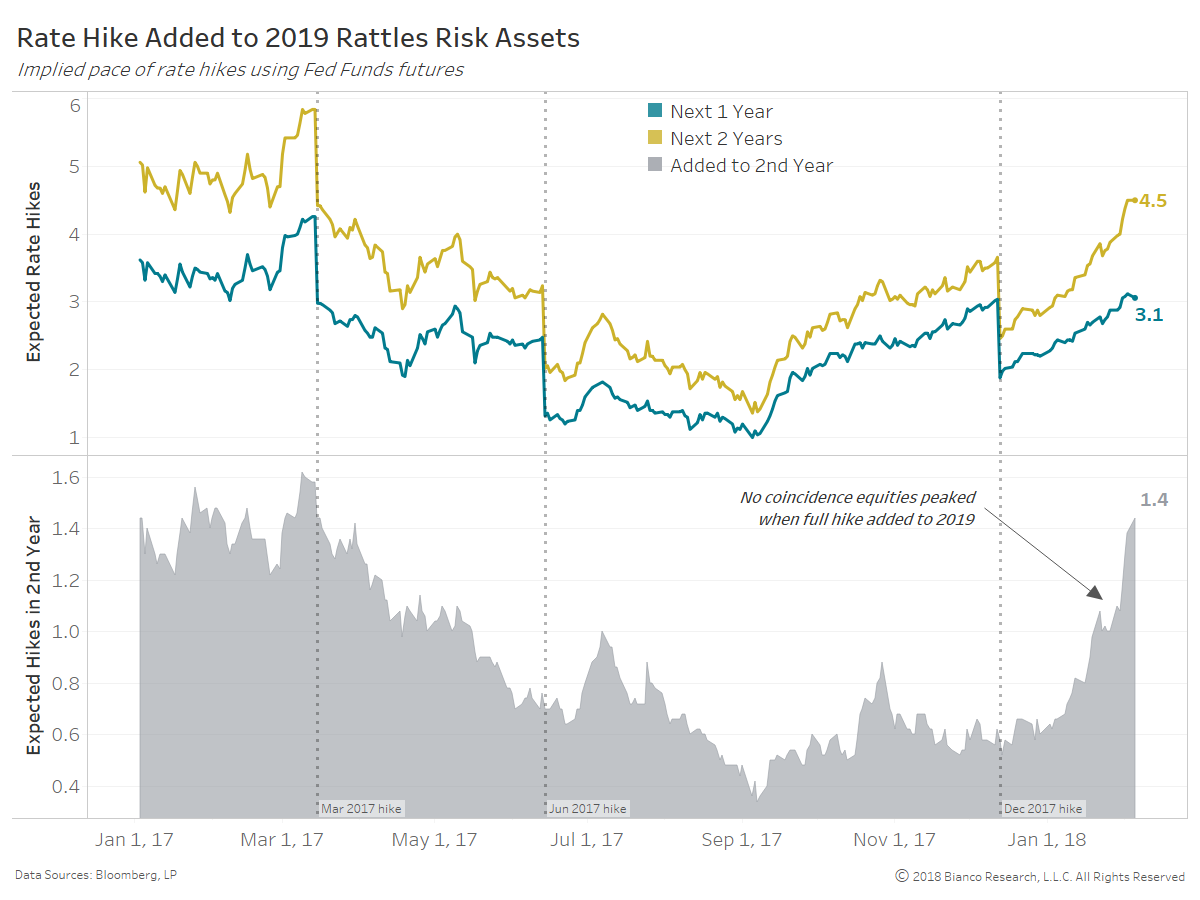
Market volatility abides by a simple equation including economic growth, inflation, and expectations for central bank tightening. There is no coincidence equities grumbled and peaked when markets began pricing in greater than 2.5 hikes over the next twelve months on January 26th, 2018. In addition, we have seen a swift addition of a 2019 hike, potentially pulling closer rate hikes as Davies suggests in his article above.
The chart below shows expectations for the number of hikes by the FOMC over the next one (blue) and two (yellow) years. The bottom panel shows the spread or the number of anticipated hikes in the 2nd year ahead. Markets began pricing in a 2019 hike on January 29th, the very day the S&P 500 began its descent.
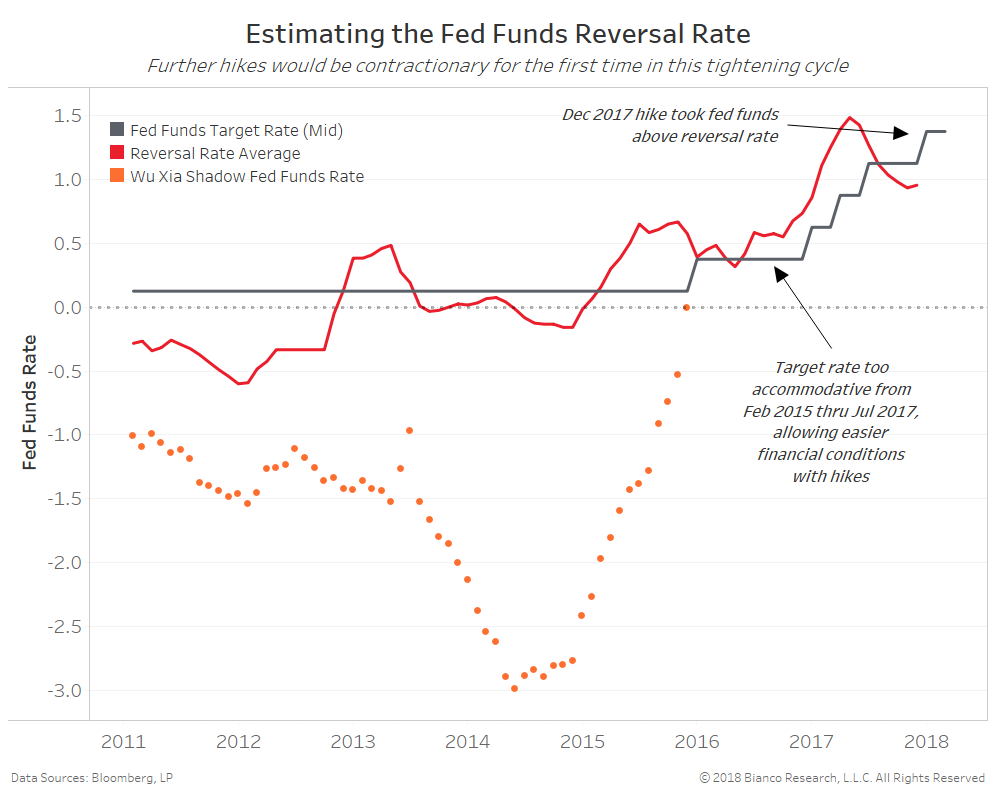
The neutral rate may not be increasing, but a faster pace of ‘getting there’ is spooking markets. We continue to rely on the concept of the ‘reversal rate,’ which measures the fed funds rate capable of causing a contraction in deposits, lending, and leverage.
The chart below shows our estimates for the reversal rate (red line) along with the target (gray line) and Wu-Xia shadow fed funds rate (orange dots). The target rate resided below the reversal rate post-crisis until the December 2017 hike, allowing financial conditions to remain ultra-easy. However, going forward hikes could tap the breaks on easy financial conditions.
All in all, continued tightening would likely slow growth, but not necessarily lead to a protracted drawdown by risk assets. A strong economic backdrop world-wide and hints of wage growth are not the makings of a bear equity market. The end result would be a return to higher volatility and risks, a condition active management would greatly enjoy.