- Bloomberg – Treasury Curve Flattening Is Back
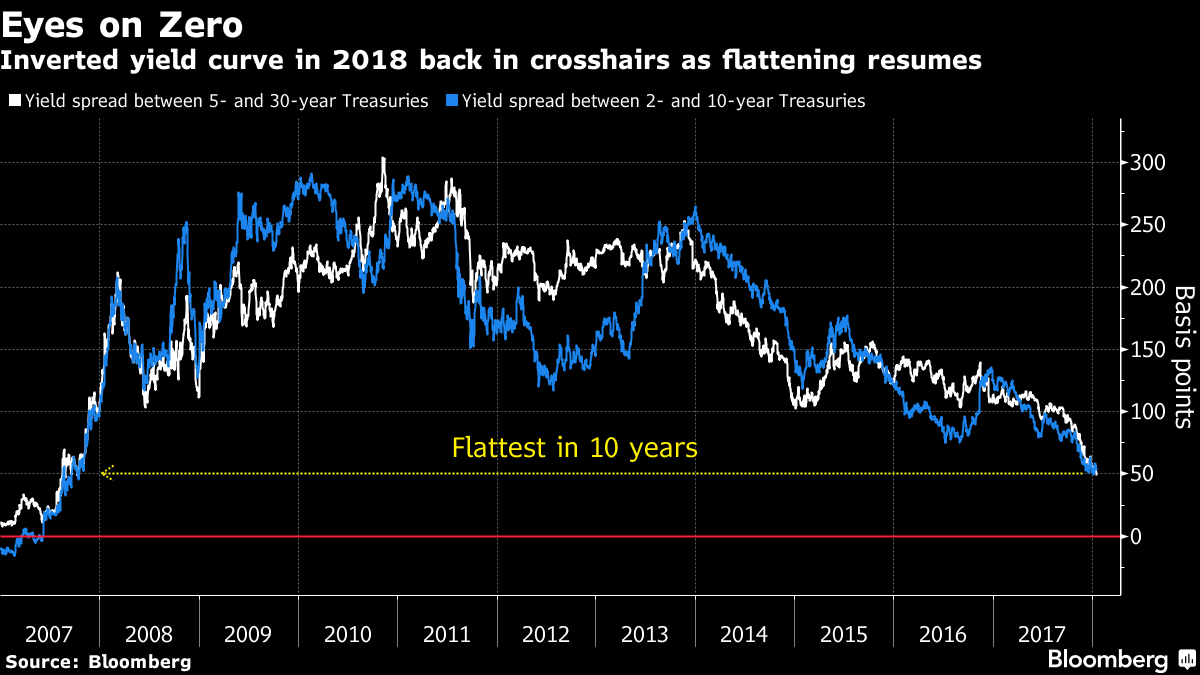
The great yield curve steepening of 2018 barely lasted a day.
After the spread between 2- and 10-year Treasury yields suffered its biggest daily widening since 2016 on Jan. 9, it’s gone on a flattening binge. Meanwhile, the curve from 5 to 30 years touched a 10-year low of 47.2 basis points Tuesday, breaking the mark of 50 basis points that BMO Capital Markets strategists see as a “battleground” on the way to their call for an inverted curve in 2018.
Summary
Comment
Recent posts revealed a negative correlation between soft, survey-based U.S. data and the Treasury yield curve. Periods of improving optimism by consumers and businesses, like we have witnessed post-Trump election, have historically been dominated by flatter yield curves. Conversely, an eventual retreat to waning optimism have coincided with predominately steeper yield curves.
Can U.S. soft and hard data continue such swift improvements throughout the first half of 2018? Probably not. Will the Federal Reserve slow or delay tightening in response? Dampening tightening expectations would likely keep the Treasury curve stable-to-steeper. But, economic cycles across the globe have also reached ‘peak form’ will keep foreigners preferring the safety and higher-yielding Treasury market.
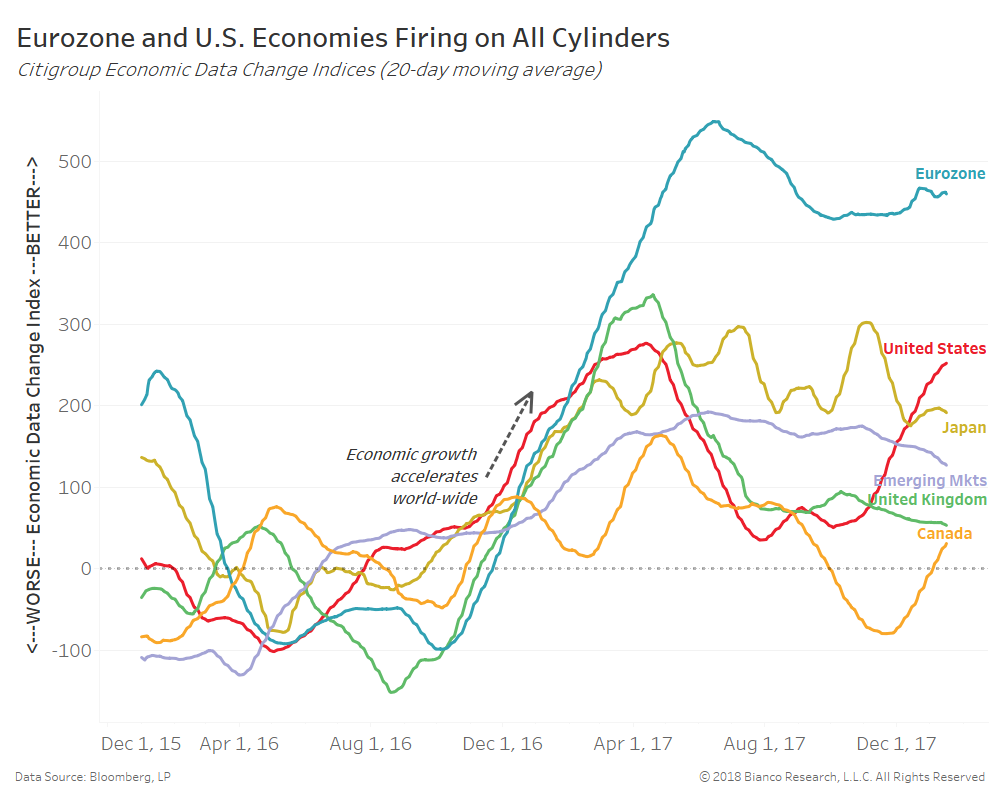
The chart below shows Citigroup Economic Data Change Indices for major economies since 2016, which measure realized economic data relative to one-year averages. Therefore, above zero indices indicate above-average economic growth.
The U.S. and Eurozone’s strong rates of economic growth have reached their 87th and 90th percentiles in relation to data since 2003. Triathletes ramp up the intensity and duration of swimming, biking, and running in the weeks ahead of a race before tapering. Economic growth appears to have put in quality training hours from late 2016 through current. But, economic growth cannot endure long periods of sustained intensity just like triathletes without incurring setbacks.
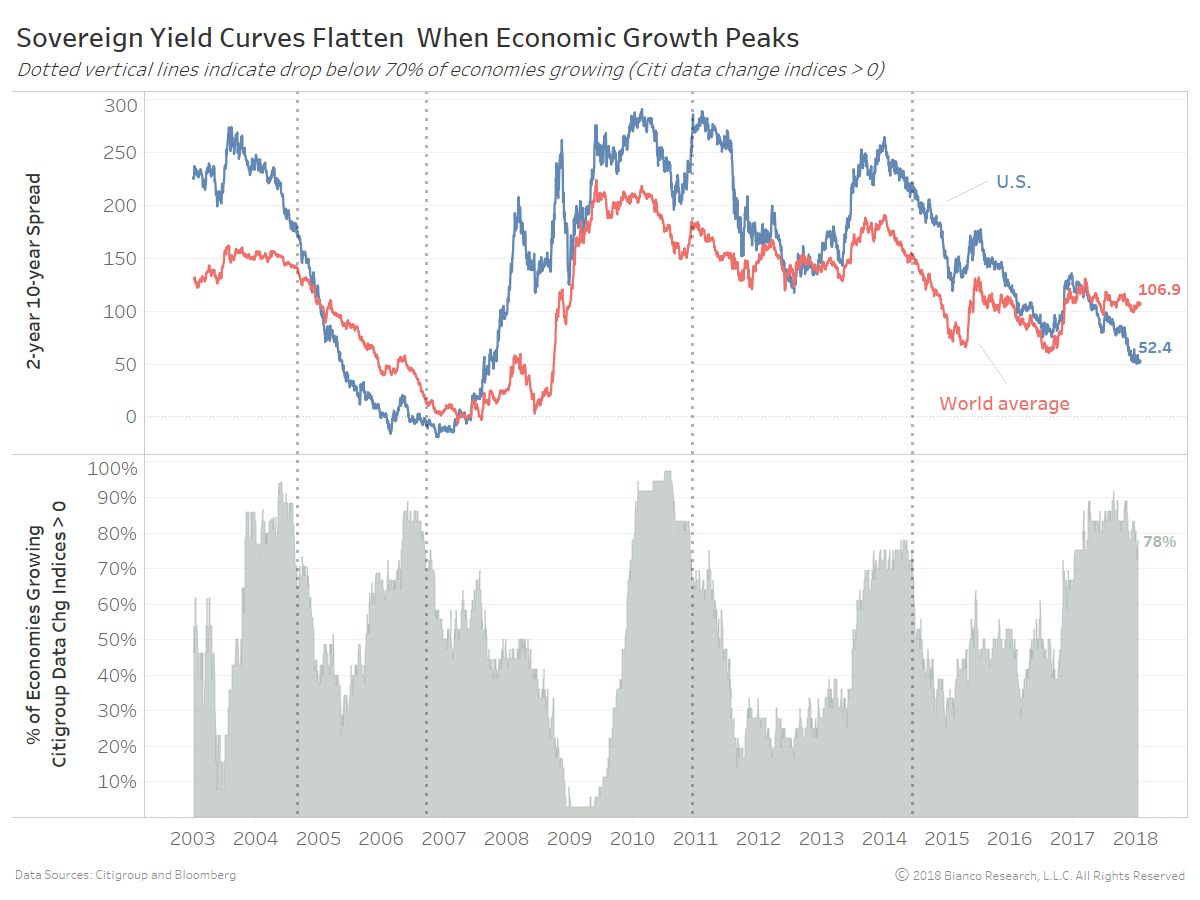
The next chart shows the U.S. (blue) and world average (red) sovereign 2-year 10-year spreads in the top panel along with the percentage of economies growing above one-year averages in the bottom panel. We again use Citigroup Economic Data Change Indices for 27 independent countries to assess growth.
A strong world economy defined by 70+% of economies growing above one-year averages has never persisted for greater than one year. The current period of booming growth began in early January 2017.
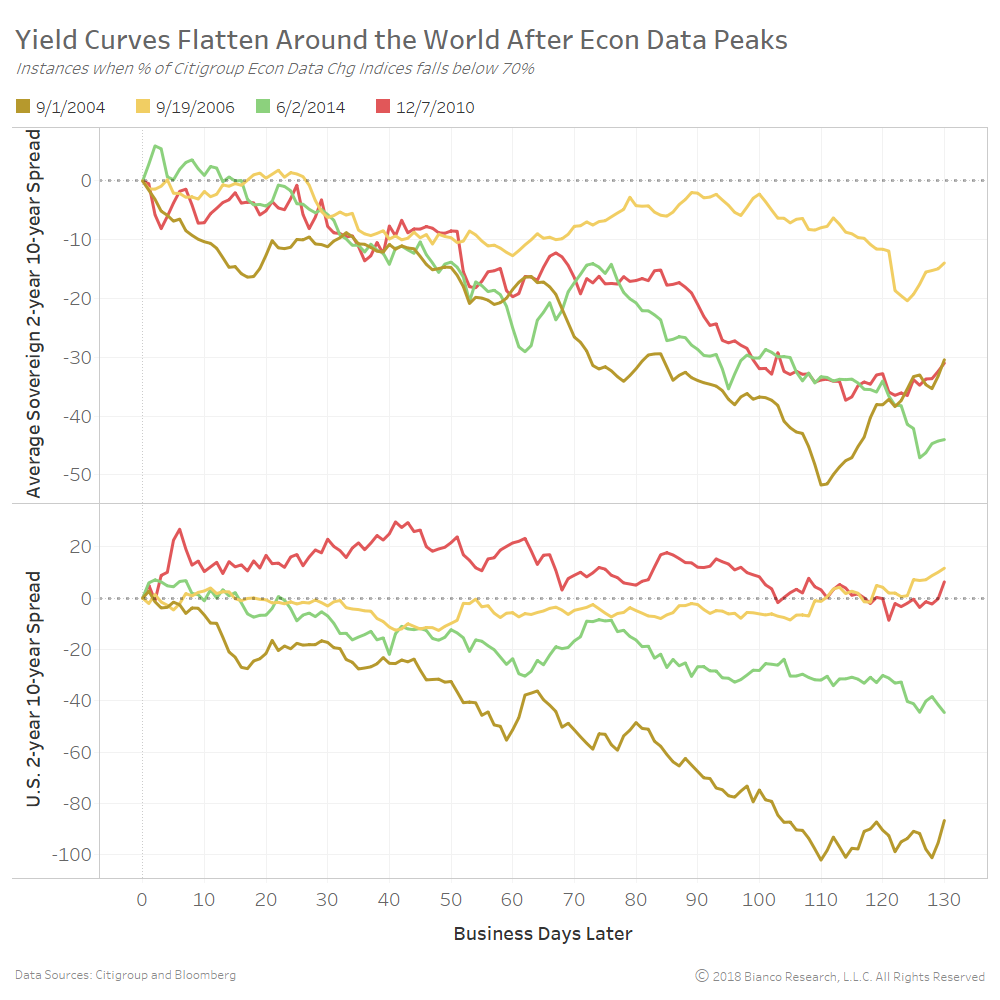
An eventual drop back below 70% (dotted vertical lines) has been followed by swift periods of flattening yield curves across the globe.
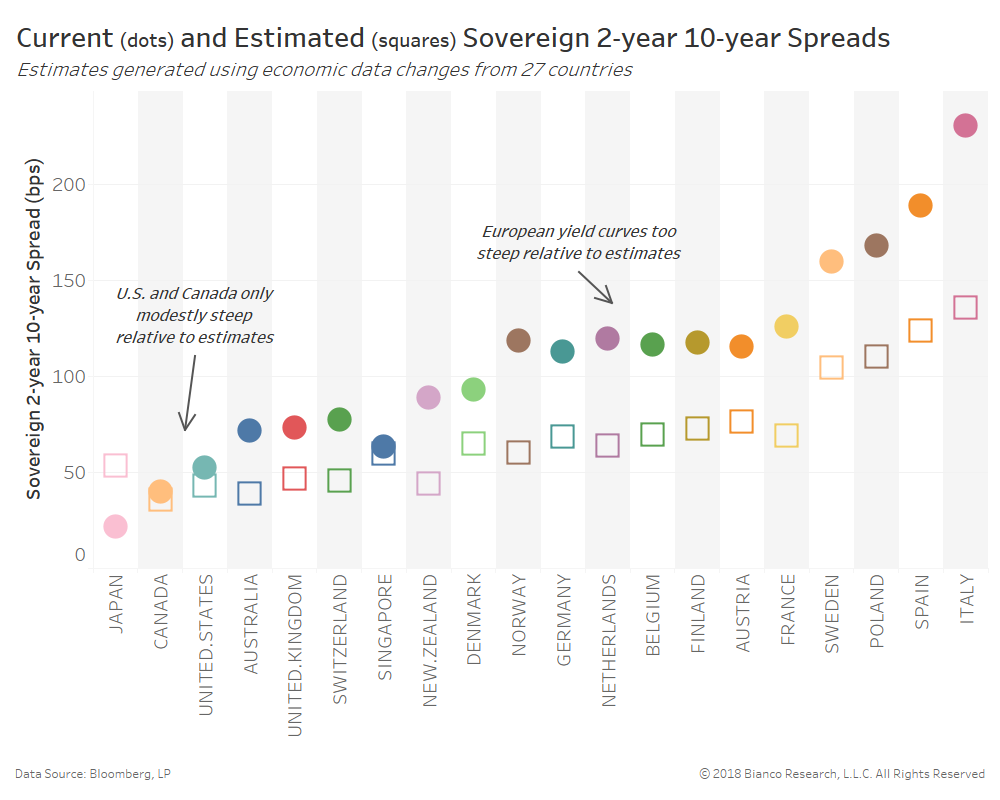
The chart below provides current (dots) and estimated (squares) sovereign 2-year 10-year spreads according to economic data changes from across the globe. The model indicates where yield curves should reside according to the ebb-and-flow of economic data produced by 27 individual countries.
The U.S. is estimated at 43.1 bps, not far from our other model focused exclusively on U.S. economic data. But, nearly all of Europe’s 2-year 10-year spreads are extremely steep relative to both the U.S. and their own estimates.
The German curve should be at 68.6 bps versus current at 113 bps. Historically, such strong Eurozone growth would prompt a more hawkish, tightening tone from the ECB. The current cycle is clearly different from Draghi who seems hesitant to scare markets beyond indicating an end to purchases in September 2018. Financial markets are finally expecting one hike by the ECB over the coming 12 months for the first time since late 2015.
Will the ECB heed a rapidly rising euro by tempering tightening expectations? The ECB may truly be in a tough spot after a period of such strong economic growth.
A surprise rebound in inflation or simply continued strong economic growth may force the ECB’s hand, which is flattening-friendly. Conversely, a shift to underwhelming economic growth across not only the Eurozone but the world would put pressure on the long end of the curve. Either way, flattening is the path of least resistance.