Summary
Comment
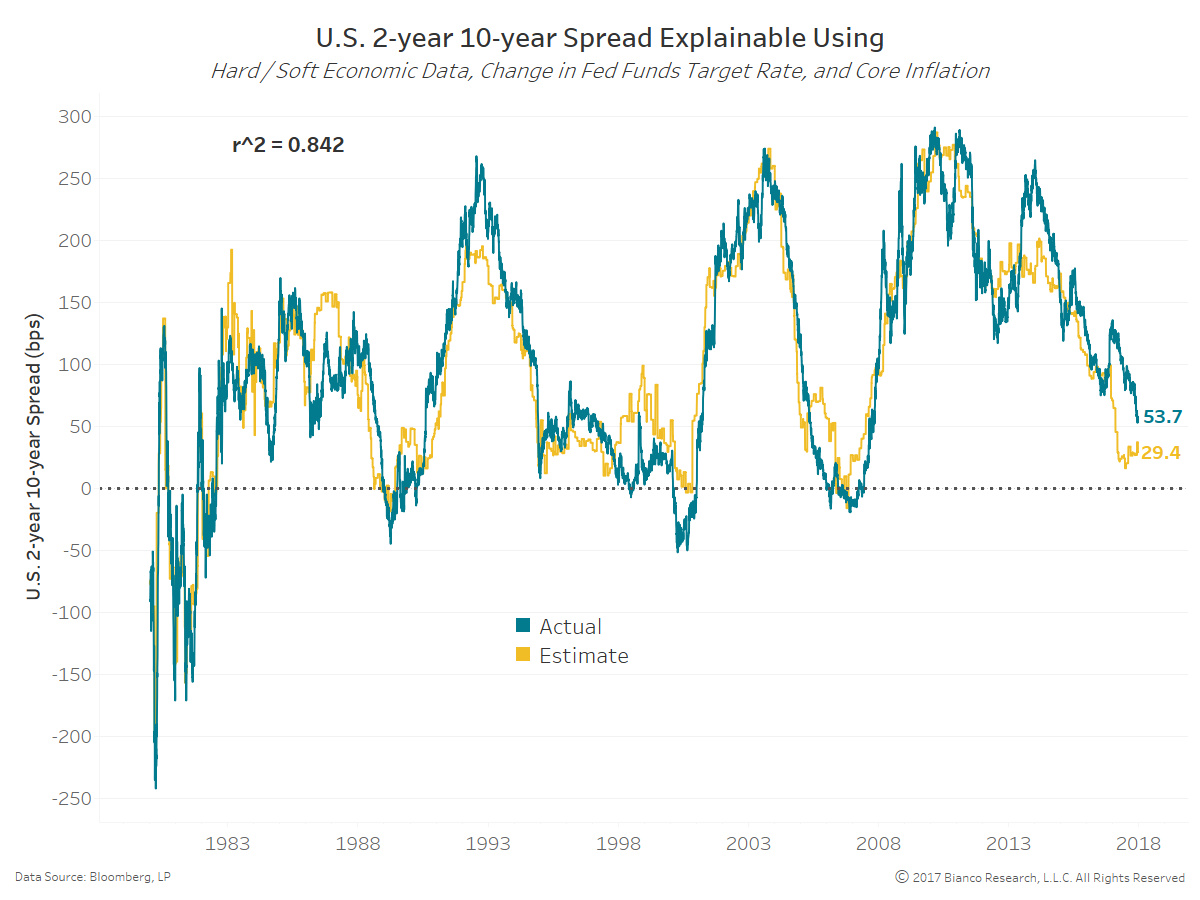
We can estimate the level of the U.S. 2-year 10-year spread quite easily using four simple and intuitive variables:
- Hard economic data
- Soft, survey-based data
- CPI ex-food & energy (YoY)
- 3-year change in the fed funds target rate (including Wu-Xia)
Estimates using a generalized additive model (GAM) are shown below in yellow. The r^2 is 0.842 even while including the erratic nature of Fed policy of the early 1980s. Current estimates place the U.S. 2-year 10-year spread at 29.4 bps, meaning recent flattening really is NOT out of the ordinary compared to past relationships and cycles. Additionally, the curve likely has further room to flatten.
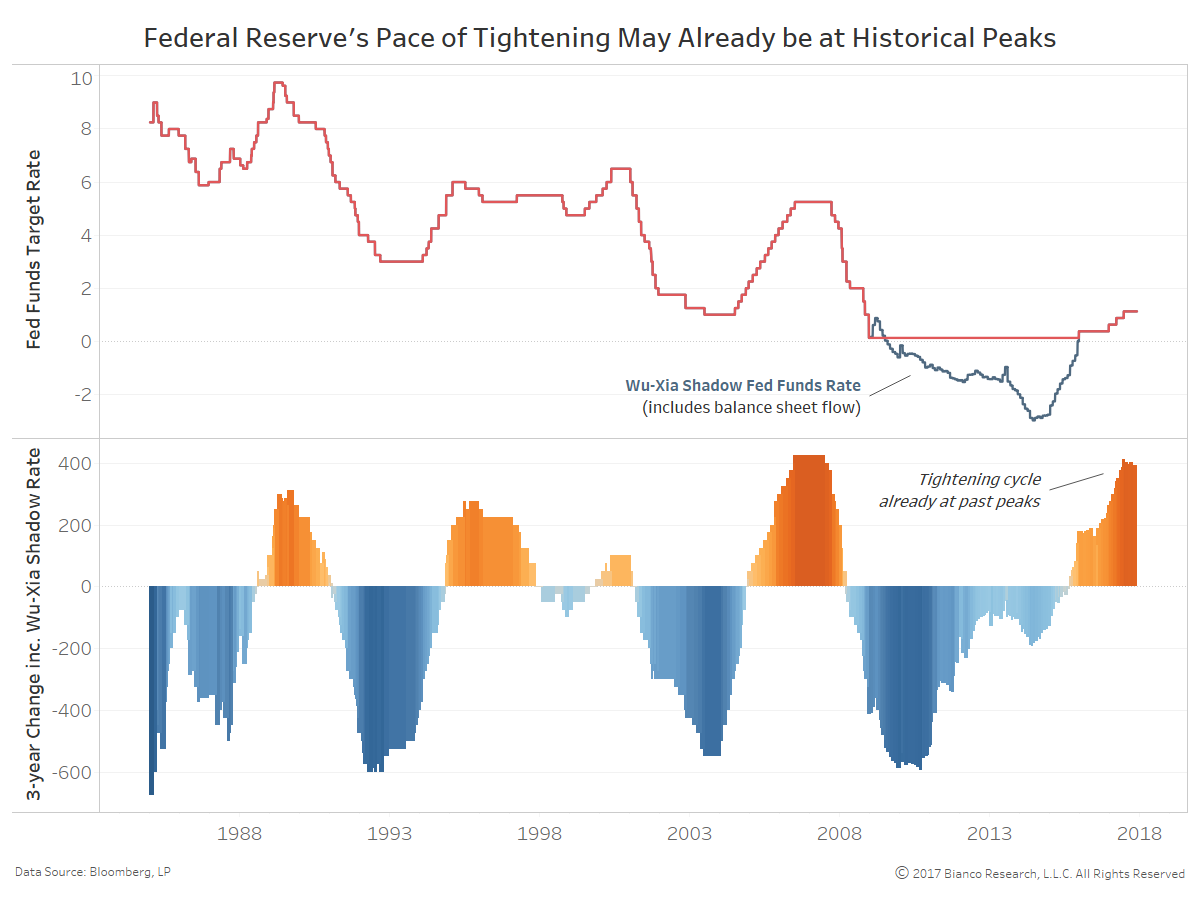
The next chart shows the fed funds target rate (red) along with the Wu-Xia shadow fed funds rate (blue) in the top panel. The Wu-Xia shadow rate offers an estimation by incorporating the flows of quantitative easing (i.e. expending Fed balance sheet).
The bottom panel shows the three-year change in the fed funds target rate while using the shadow rate during balance sheet expansion. Tightening recently exceeded 400 bps according to this measure, in contrast to the four hikes totaling 100 bps. History suggests the Federal Reserve does not typically maintain such a hefty pace of tightening, meaning similar levels were the peak during the ’94/’95 and ’04/’06 cycles.
Not surprisingly, markets continue to price in significantly less tightening (hikes) than the Federal Reserve and many economists. Fed funds futures and OIS suggest only one additional hike in the twelve months ahead.
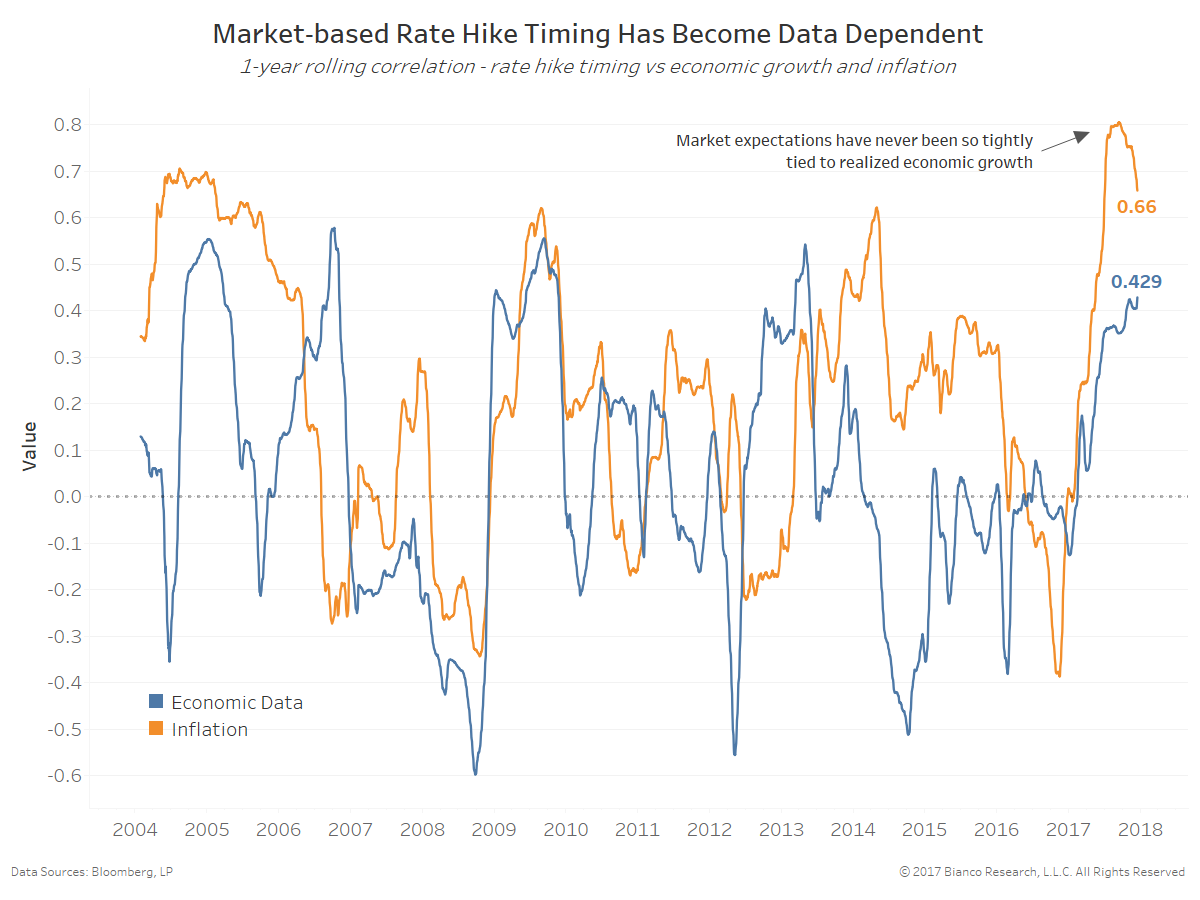
The chart below shows the one-year rolling correlation of market-based rate hike timing to both economic data (blue) and inflation (orange). Funny enough, financial markets are more data-dependent on realized inflation than the Fed. The correlation between rate hike timing and inflation remains higher at 0.66 than seen since 2005.
The yield curve will continue to flatten as long as the financial markets continue to see no realized inflation, while the Fed is hopeful given economic data improvements.
Bigger picture, languishing inflation remains a global dilemma. The animated scatterplot below shows the relationship between OECD composite leading indicators (x-axis) and CPI less food and energy (y-axis) from Q1 2011 through current.
This perspective of growth versus inflation provides an indication of whether or not each country is achieving its goals. Central banks want to see values in the upper right quadrant. Unfortunately, note how 2.0% year-over-year core inflation is a significant hurdle most countries are unable to poke above even given quite strong economic growth.
We believe Sweden, who is one of the only developed countries achieving both economic and inflation targets, remains a potential leader for the Eurozone in regards to tightening policy.