U.S. Inflation Expectations Rebounding with Economic Surprises


Summary

U.S. inflation expectations should continue to rebound in the event economic data surprises (beats) make a triumphant return. History suggests TIPS breakevens widen with great frequency after a period of extreme data misses.

Comment

Inflation remains the dominant topic for the Fed and market participants. The chart below shows the percentage of T.V. news coverage of the Federal Reserve including each category (inflation, uncertainty, and financial stability). However uncertainties including political and financial stability concerns are rapidly on the rise. Do not forget the Fed continues to suffer from short-term-ism.


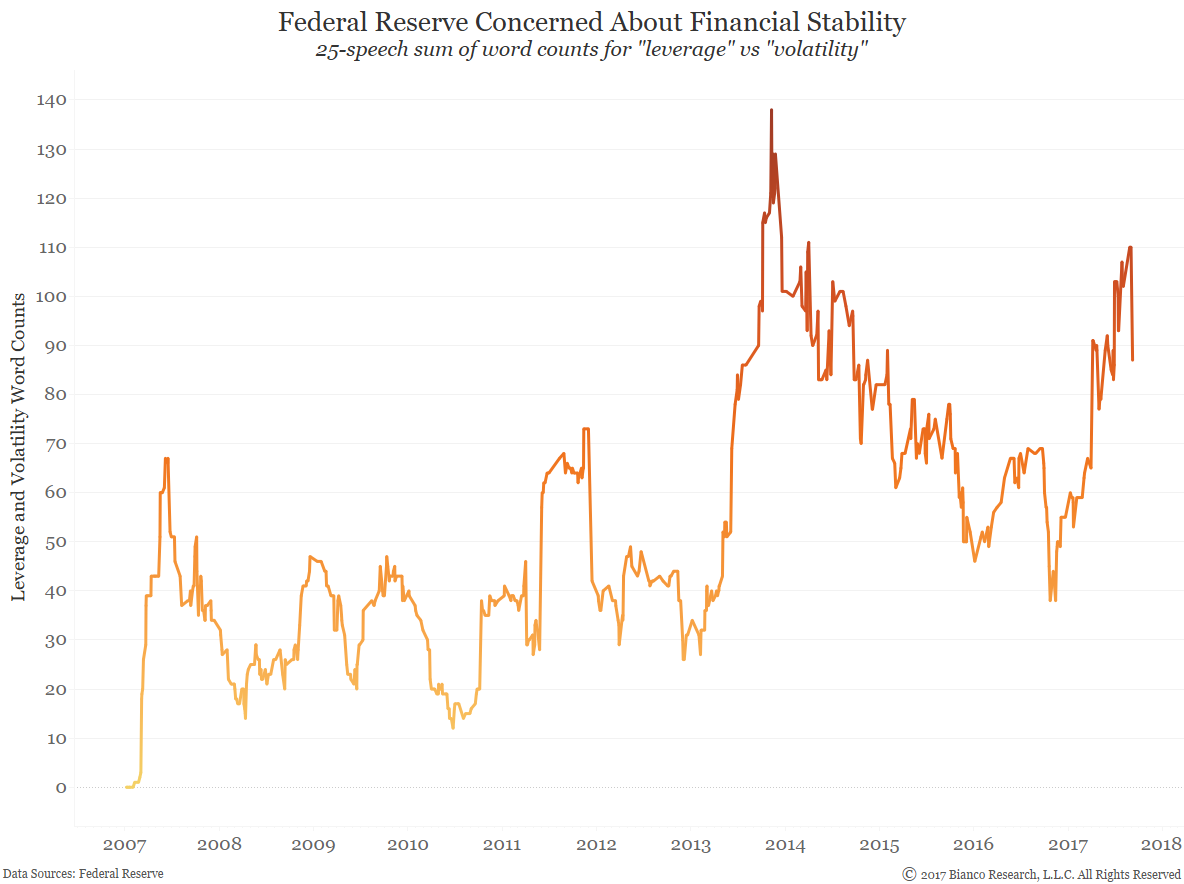
The Fed’s potentially hidden mandate of financial stability is again rearing its head. The next chart shows counts for ‘leverage’ or ‘volatility.’ Excessively easy financial conditions are likely heavily on their minds.

The likely slow trickle of balance sheet reduction will keep markets fixated on potential rate hikes. Low inflation has likely driven down the neutral rate to approximately 125-150 bps by our own calculations. Another hike (or more swift reduction in the balance sheet than expected) would cause the first tightening in financial conditions during this cycle. A contraction in deposits and lending growth shows a real potential to further flatten the U.S. Treasury yield curve, which is not favorable for the economy. 


The Fed wants to maintain a long-term focus to avoid getting tripped up by transitory and/or short-lived forces. However, their own use of ‘long-term’ versus ‘short-term’ in speeches and other releases indicates a short-term focus persists following the financial crisis. 


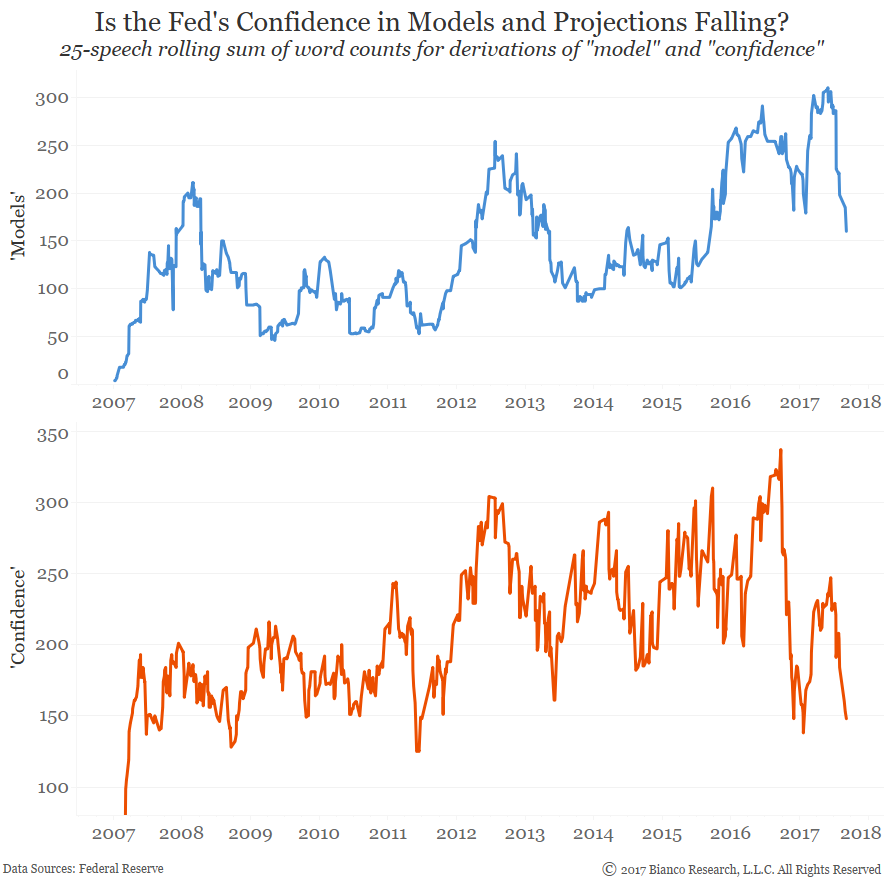
The Federal Reserve had never pushed their models and projections as much as they did during the spring of 2017. Lagging inflation relative to employment is seemingly not due to transitory forces. This conundrum is forcing economists and Fed officials to question the Phillips Curve and historical relationships between wages and the approach of full employment.

Not surprisingly, Fed officials have recently diminished the frequency of model and forecast comments (top panel). Notably, the uttering of ‘confidence’ has also tumbled (bottom panel).


Inflation surprises (i.e. beating economists’ estimates) in the U.S. have been very difficult to come by following the financial crisis. The chart below shows Citigroup Inflation Surprise indices for major economies with values above zero indicating beats and values below zero indicating misses.


In fact, the U.S. is at the bottom of the list of economies producing inflation surprises since 2012. Only three months (4%) have seen the U.S. inflation surprise index above zero. No wonder Brainard and some other Fed officials are leaning toward inflation running hot above 2% before further tightening. Current low levels of inflation have dragged the neutral rate lower, which we believe resides near 125-150 bps. Another hike in December and/or balance sheet reduction will very likely cause tighter financial conditions for the first time in this cycle.


So why are inflation expectations for the U.S. rebounding? We previously indicated U.S. 10-year TIPS breakevens have always widened after the U.S. Citigroup Economic Surprise index reached an extreme below -60, which occurred June 15th, 2017. Breakevens are 16 bps wider since this date.


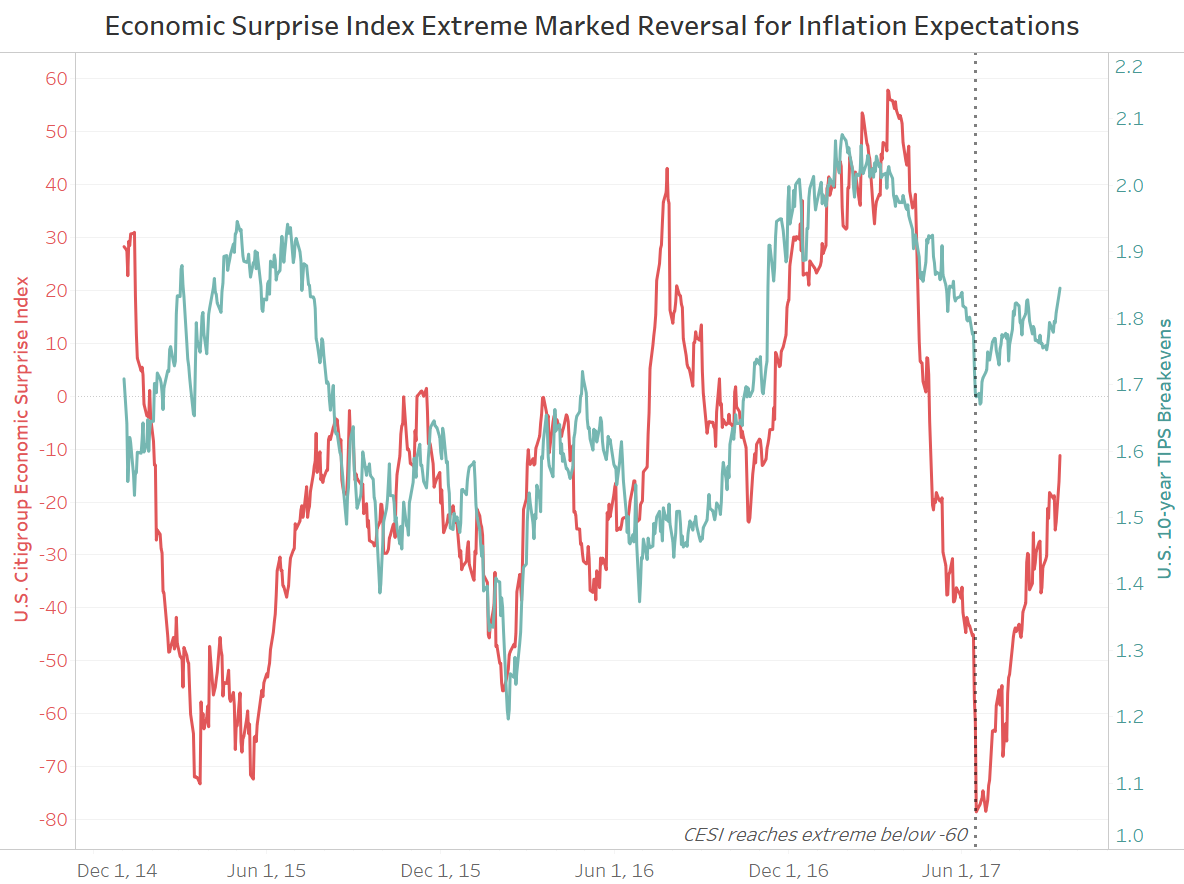
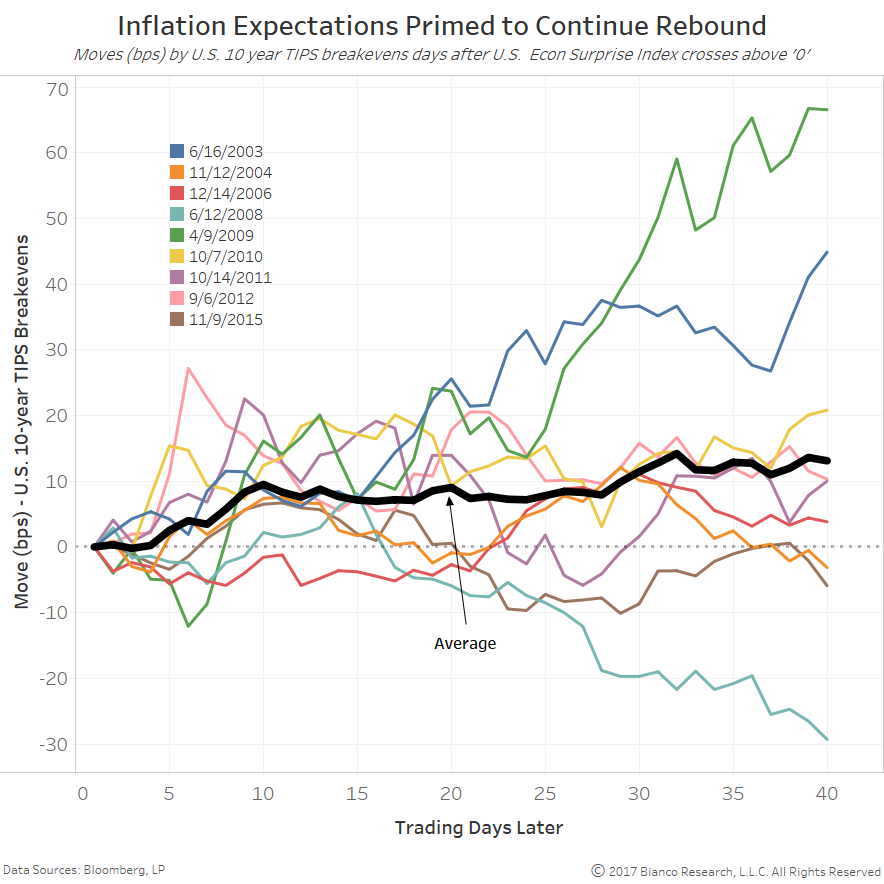
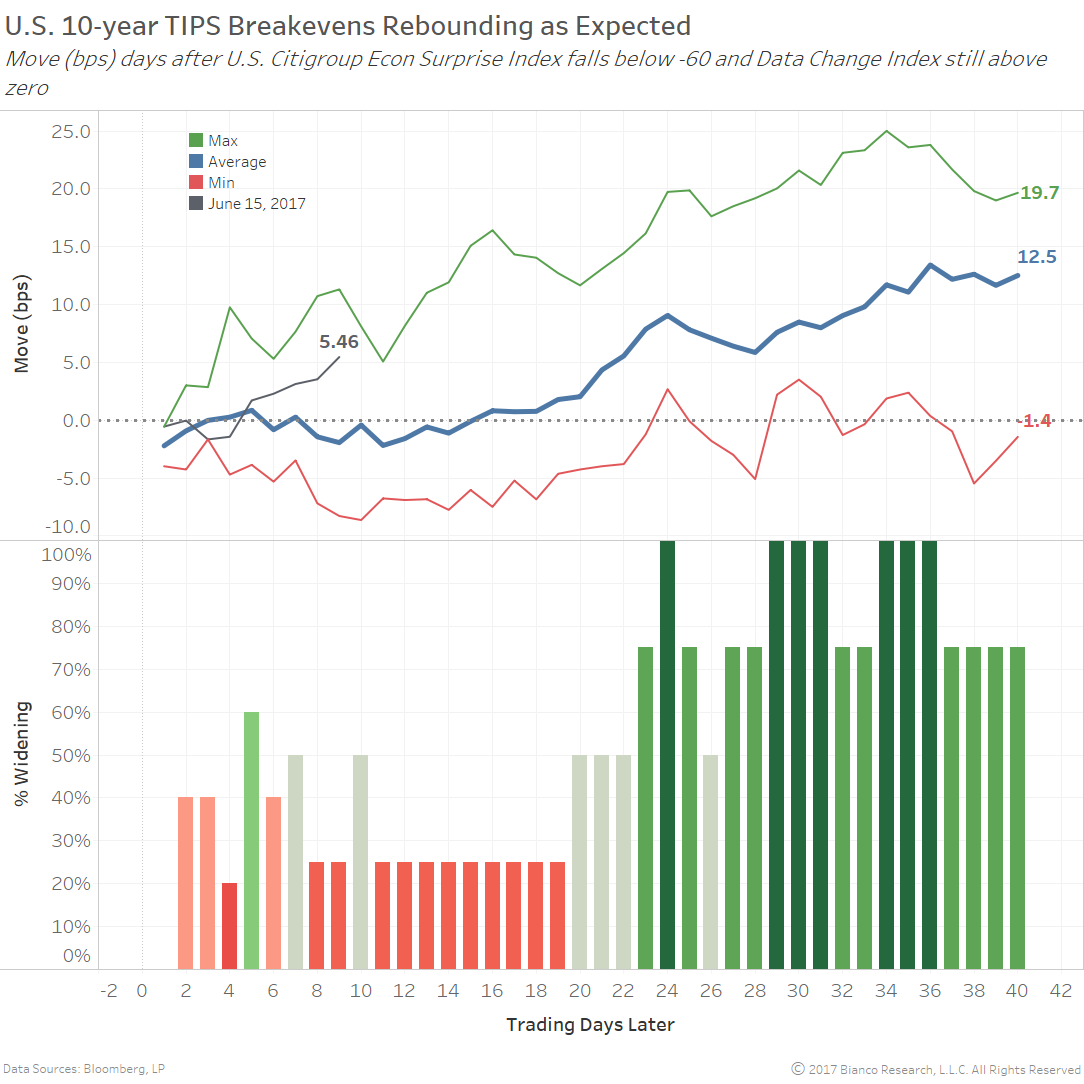
We now look to expected moves by inflation expectations in the event the surprise index continues its rebound above zero, meaning a return to concerted data beats. The chart below shows past moves in U.S. 10-year TIPS breakevens days after the surprise index recovers from below -60 and breaks above zero.

U.S. 10-year breakevens widened 30-trading days later 78% of past instances by an average of 11.5 bps.


REQUEST A FREE TRIAL