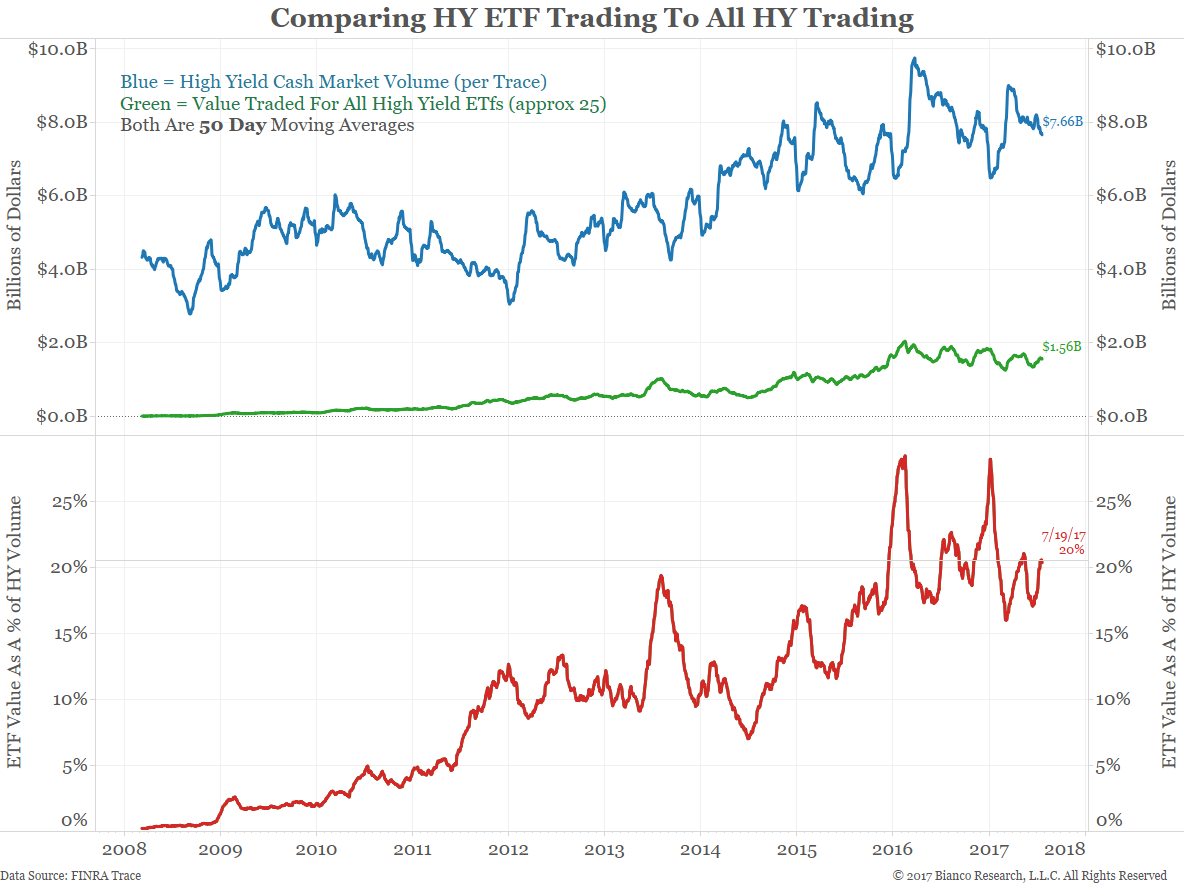
The blue line below shows a 50-day moving average of the total trading volume in actual high-yield bonds as measured by TRACE. In the 50 days ending July 19, $7.66B of high yield bonds traded on an average day.
The green line shows the 50-day average of the total dollar volume (price multiplied by shares) for the 25 largest high-yield ETFs. HYG accounts for roughly two-thirds of this total. In the 50 days ending July 19, $1.56B of high-yield ETFs traded on an average day.
The red line, which shows the ratio of the green line to the blue line, shows the ETF market is currently 20% the size of the underlying cash market.
This is how one-fifth of the high-yield market now trades.
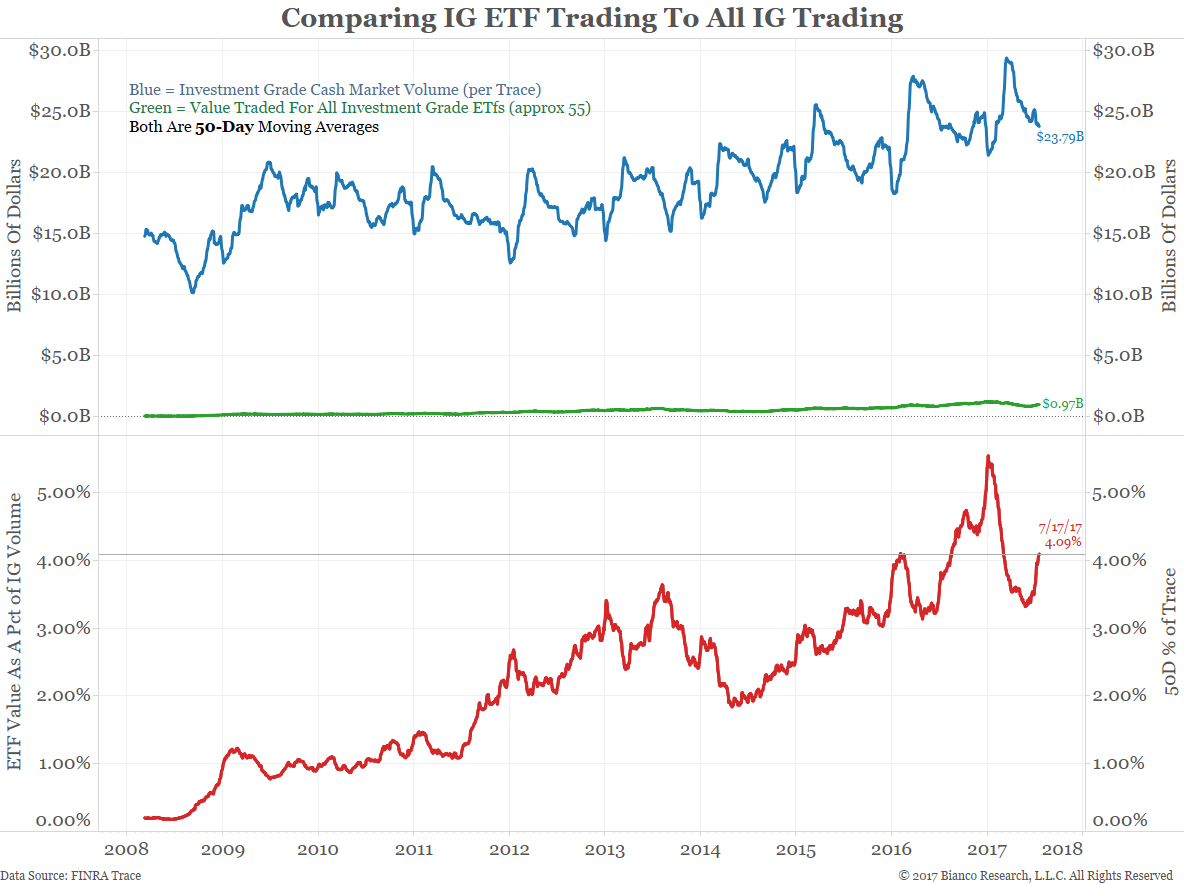
By contrast. the chart below shows the same metric for investment grade. Only 4% of investment grade market trading is driven by ETFs. Other than high yield, this is a large number when compared to other ETF sectors. It shows how dominant high yield is relative to its underlying cash market.