A look at S&P 500 Fundamentals.

Selling volatility through leveraged ETFs has fallen out of favor this month. The past 20 days have seen $218 million flow out of short volatility ETFs and $241 million flow into leveraged long volatility ETFs.
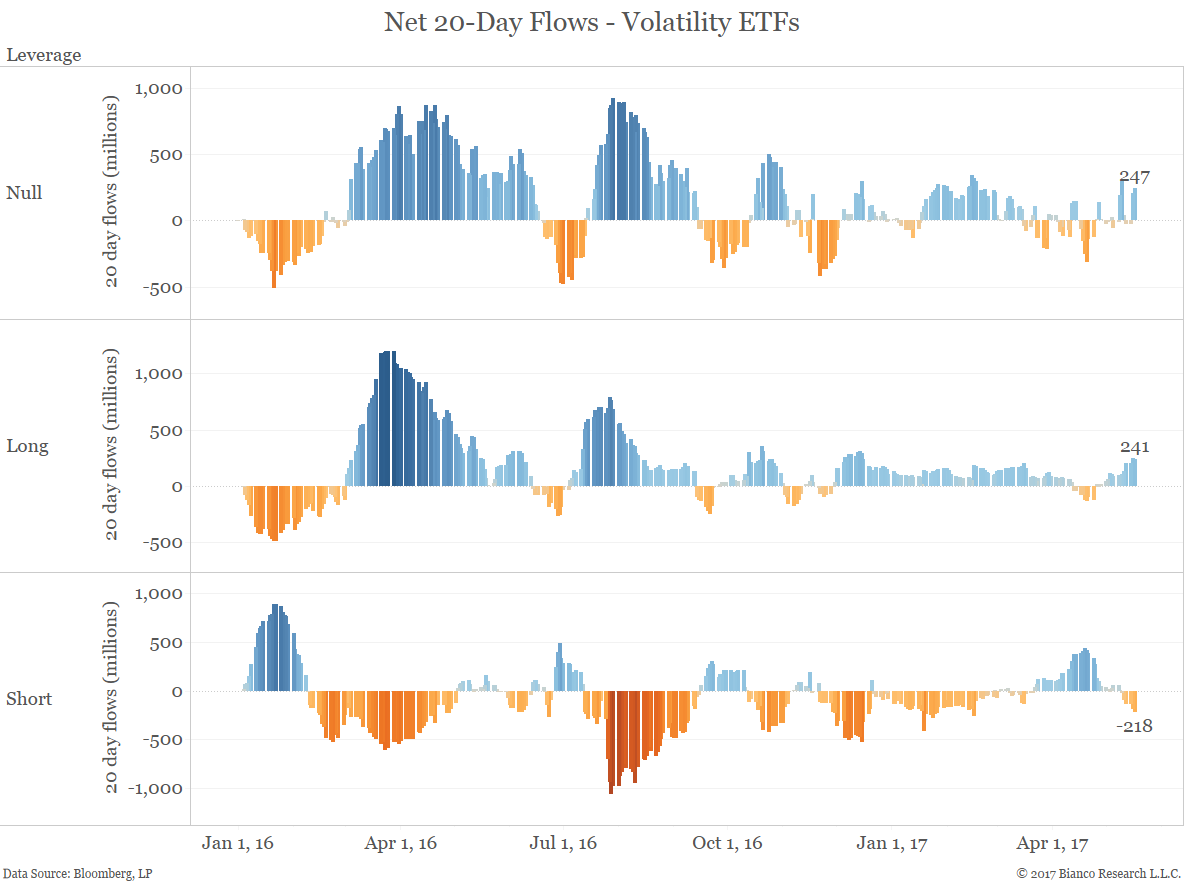
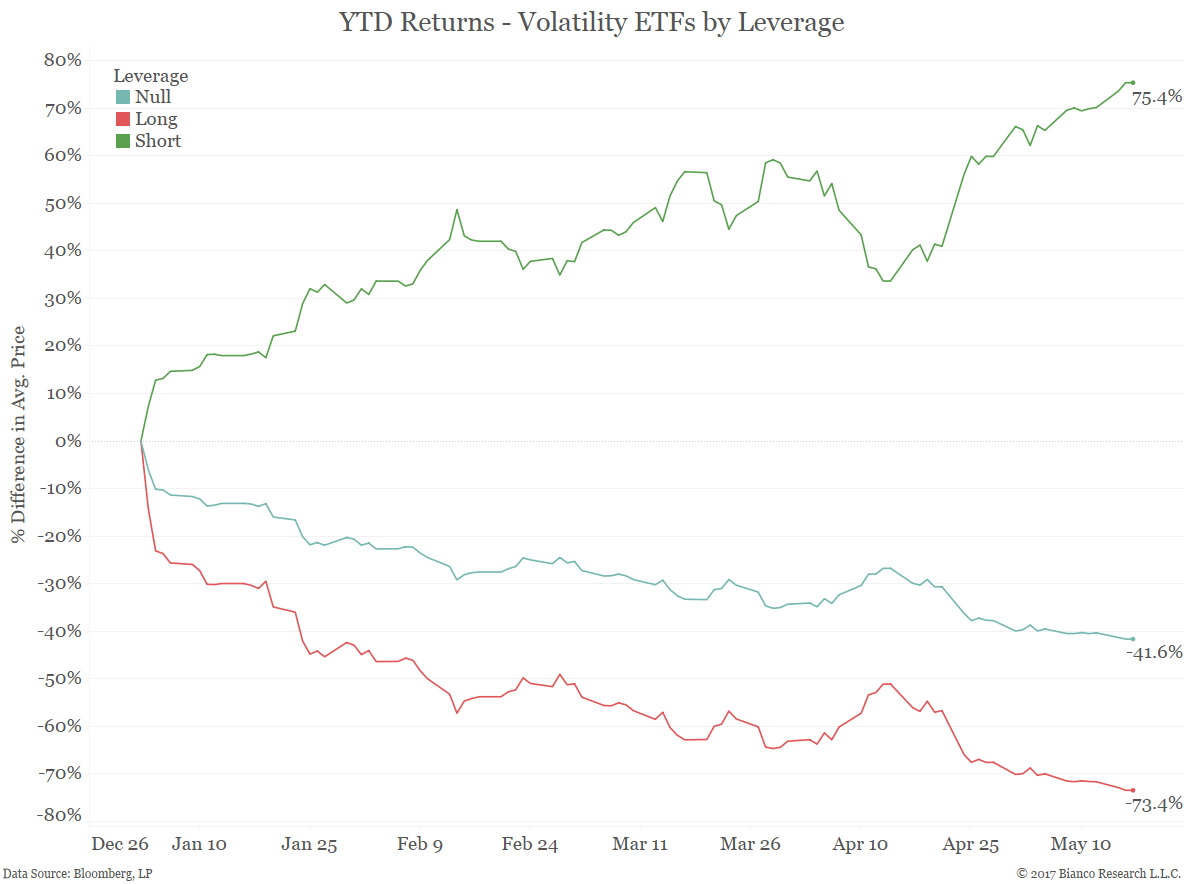
The short volatility trade has performed well even as ETF flows turned against the short volatility trade. Leveraged short volatility ETFs are +33% since mid-April. Leveraged long volatility ETFs are -22% over that same period.
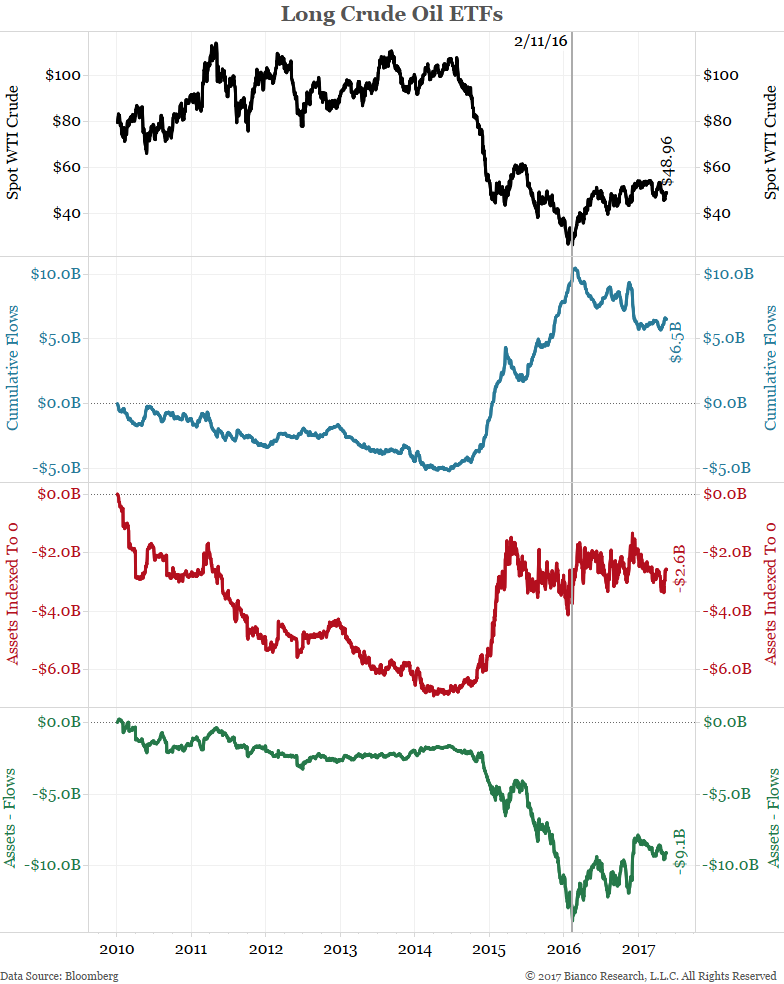
Long And Short Crude ETF Assets And Flows.
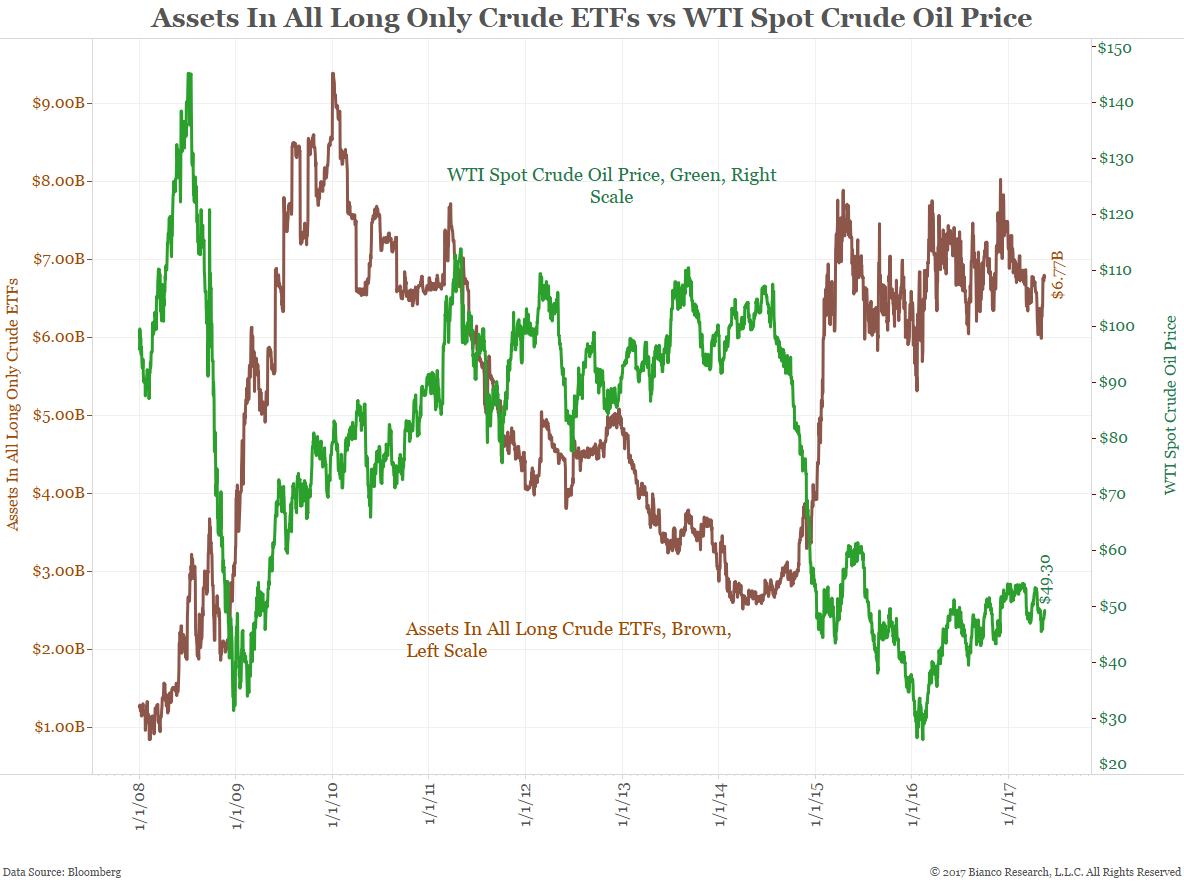

Long Energy ETF flows continue to increase …

… As cumulative flows in long crude oil ETFs have dipped since February 2016.
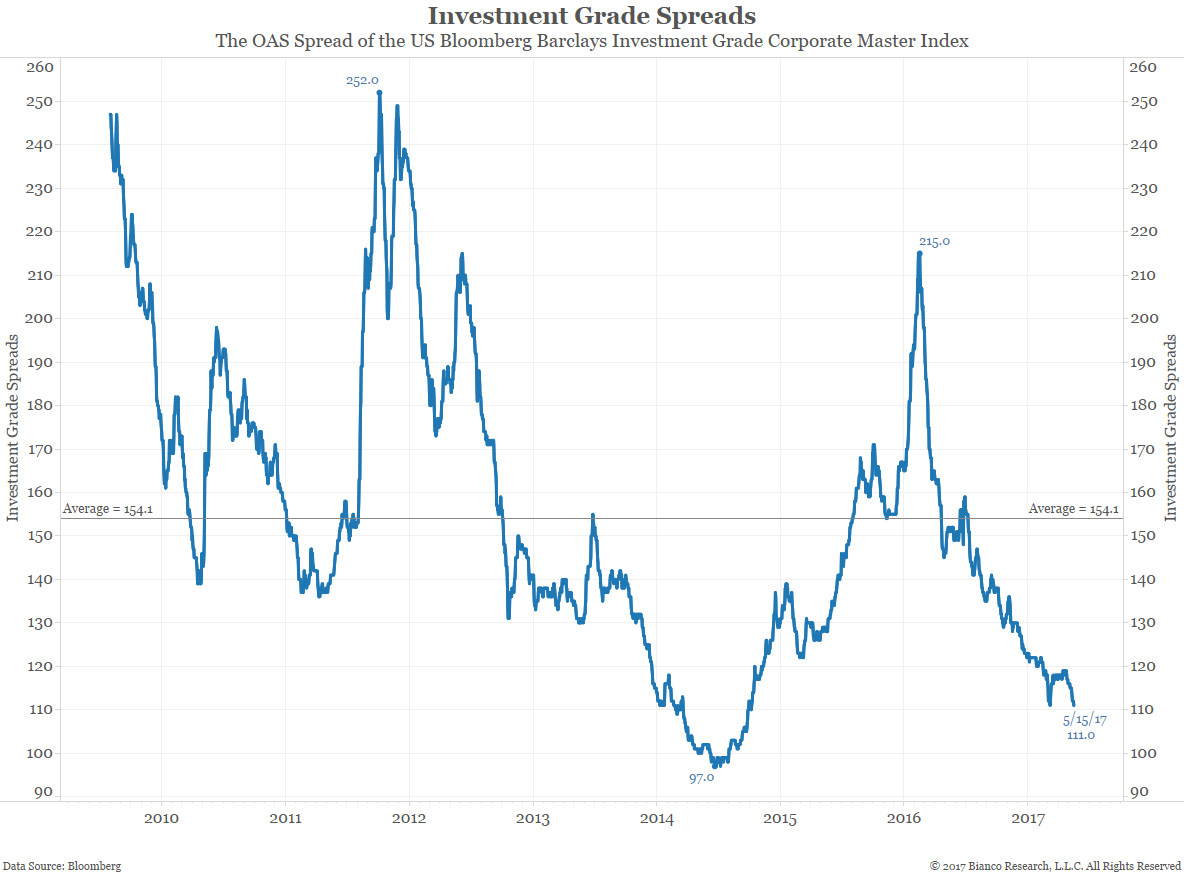
A Look at Credit Spreads.

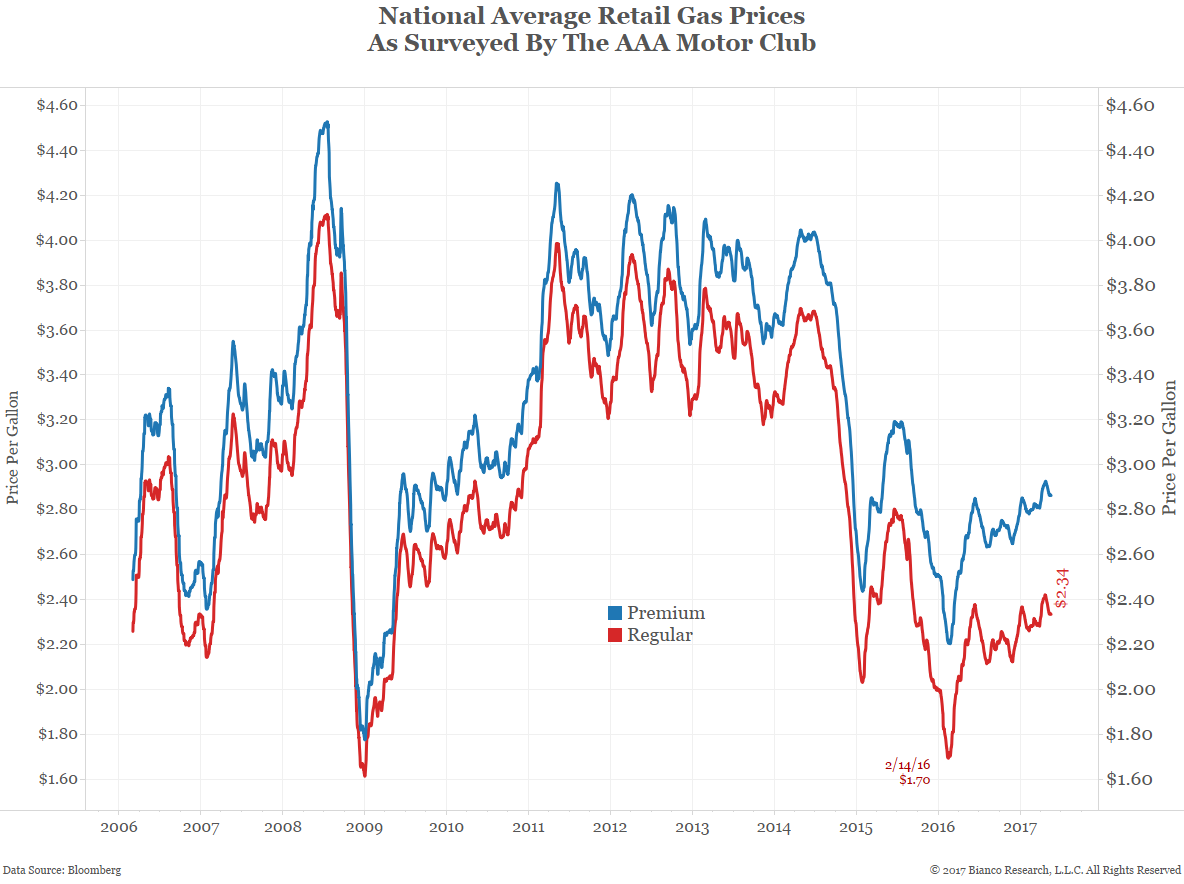
Gas Prices Remain Stable.
Interest Rates: In past weeks we looked at the long and short ends of the yield curve. This week we highlight Moody’s Aaa yields since 1913. Also of note on these charts are the recessions shown in gray.