- The Financial Times – Global surveys or hard data – which are the fake news?
In conclusion, we believe that the hard data in the US are understating activity growth in that economy, and consequently in the official GDP series for the global aggregate. We expect to see this reflected in much stronger growth in US hard data and the official GDP series for 2017 Q2. Global activity growth is unlikely to be maintained quite at the elevated levels identified by our nowcasts in Q1 (because there is statistical mean reversion in the forecasts), but we expect consensus forecasts for global growth in the 2017 calendar year to be revised upwards, perhaps substantially. - Bloomberg – It’s a Big Week for One of the Most Important Debates in Markets
The gap between soft data on confidence and other surveys that capture the optimism of the moment and expectations for policy, and hard data such as consumer spending that show actual performance, has been a hallmark of the economy this year. Figuring out which set is a better predictor of the economy in the coming months is critically important to the decisions companies and investors make this year.
Comment
History suggests hard data will follow soft data to higher growth rates. However improvements in realized economic growth does not necessarily imply risk assets will outperform. U.S. equities have a strong tendency to follow leading data like surveys over what has already come to pass.
Last week we wrote:
The chart below shows how major assets performed in the months following soft data greatly exceeding hard data. Surprisingly, the S&P 500 and U.S. dollar lag all other assets shown. Notably, TIPS and commodities are among the strongest performers. This further confirms analysis from last week showing TIPS expected to outperform given improvements in core inflation.

U.S. equity markets are still chasing these rosy expectations.
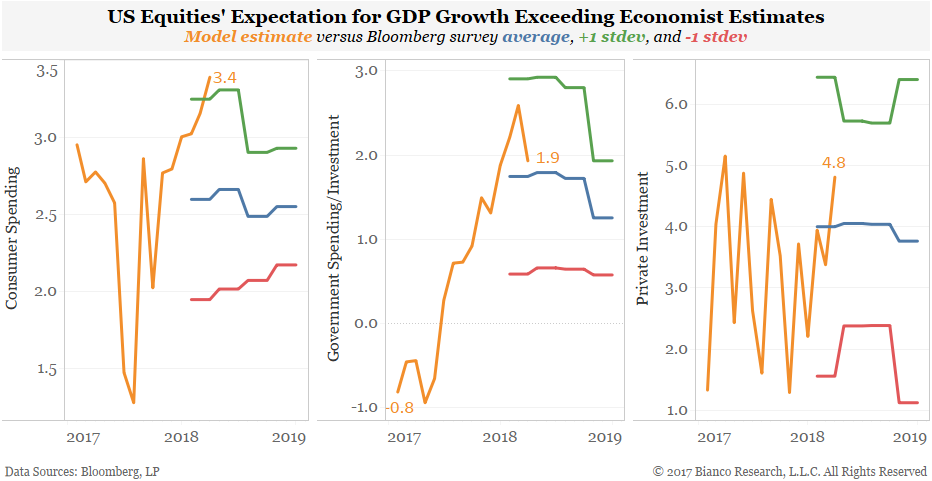
We have built models training on returns of S&P 500 industry groups ranging from energy to utilities. These models essentially find those industry groups with a strong relationship to each GDP component and then uses these same industry groups to generate forecasts for the year ahead. We are attempting to answer just how much growth equities are expecting.
The chart below shows our forecasts for three components of GDP (orange) along with the Bloomberg’s survey average (blue), +1 standard deviation (green), and -1 standard deviation (red). We forecast four-quarter averages to avoid seasonality noise.
Surprisingly, equity markets have not tempered expectations for government spending given Trump’s failed healthcare bill and fears tax reform will also not happen. However consumer spending is expected to average 3.4% by 2018, higher than the most extreme economist’s estimate (green line).
Given such lofty expectations already priced into equities, we are concerned risk assets may encounter a bumpy road this summer.
Adding fuel to the fire for skeptics of a return to strong realized economic growth, we remain concerned about inconsistencies in soft, survey-based measures.
First, consumer and business confidence has been quite different by party. The chart below shows the average change in the NFIB’s survey of small businesses for their ‘outlook on general business conditions.’ Republican presidents are greeted by much better small business optimism than Democrats. Is an inherent Republican bias helping boost confidence?

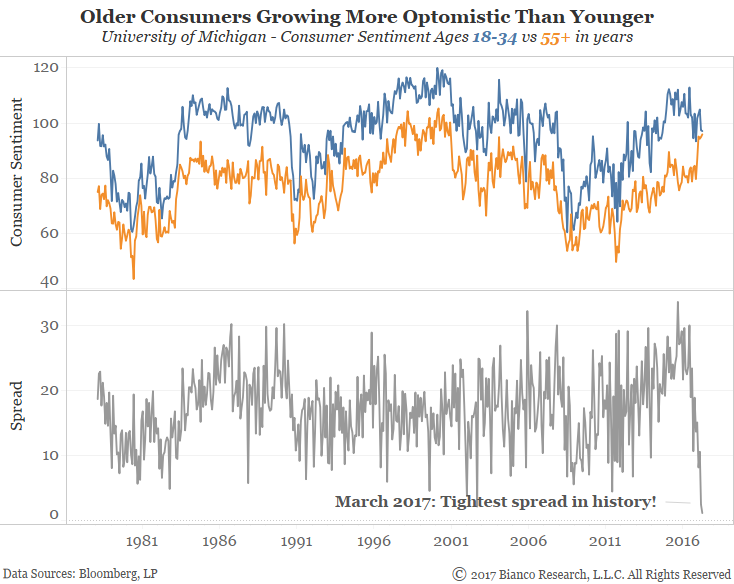
Second, younger consumers inside 35 years of age (blue line) have shown lower sentiment since the election while older consumers over 55 years of age (orange line) are increasingly optimistic. Their spread is shown in gray in the bottom panel.
The spread between young and old sentiment is its tightest in the history available since 1980, making such divergent outlooks unprecedented.
Third, we highlighted a significant divergence between consumer/business confidence and Presidential approval ratings last week. The chart below shows the ratio between a composite of consumer and business confidence over Presidential approval ratings. Similar divergences have only occurred during raucous periods including the Vietnam War and Watergate scandal.
Conclusion
U.S. equities continue to price in a very rosy outlook for consumer spending, exceeding even the highest economist’s estimate.
Any hiccups in soft data or failure of hard data to catch up would lay a very bumpy road for risk assets.
Skeptics of growth have reason for concern as consumer and business surveys offer very divergent outlooks by party and age group.