- ETF Trends (Blog) – Despite Declines, Investors Love Oil ETFs
The United States Oil Fund is off almost 27% over the past 90 days, but that glum performance is not damping some investors’ enthusiasm for oil exchange traded funds. Even with prices of West Texas Intermediate, the crude contract tracked by USO, sliding 21% last month, investors poured $821 million into USO, nearly a third of the ETF’s $2.5 billion in assets under management, reports Rupert Hargreaves for ValueWalk. The VelocityShares 3x Long Crude ETN, which tracks three times or 300% the daily performance of WTI crude, is another struggling oil exchange traded product that investors just can’t seem to get enough. As a triple-leveraged product, UWTI has been recently drubbed, plunging 64.6% over the past 90 days, but UWTI “saw inflows rise to $653 million — once again an enormous sum in comparison to the size of the fund. UWTI has $956 million in total assets,” according to ValueWalk. - ValueWalk (Blog) – Oil ETFs Devour Cash As Retail Investors Try To Pick A Bottom
July was the worst month for oil prices since the financial crisis. The price of WTI crude plunged 21% during the month, the worse single-day decline since 2008. Unfortunately, July was also the month that saw record inflows from retail investors into ETFs that track the price of oil…According to data from ETF.com, traders have been throwing money at these two exchange-traded instruments since the beginning of the year, without much success (as the figures above show). Since the start of the year, USO inflows have totaled $1.6 billion while those for UWTI have totaled $1.3 billion. All the evidence points to the fact that most of the speculators plowing money into these funds don’t have a clue.
Comment
<Click on chart for larger image>
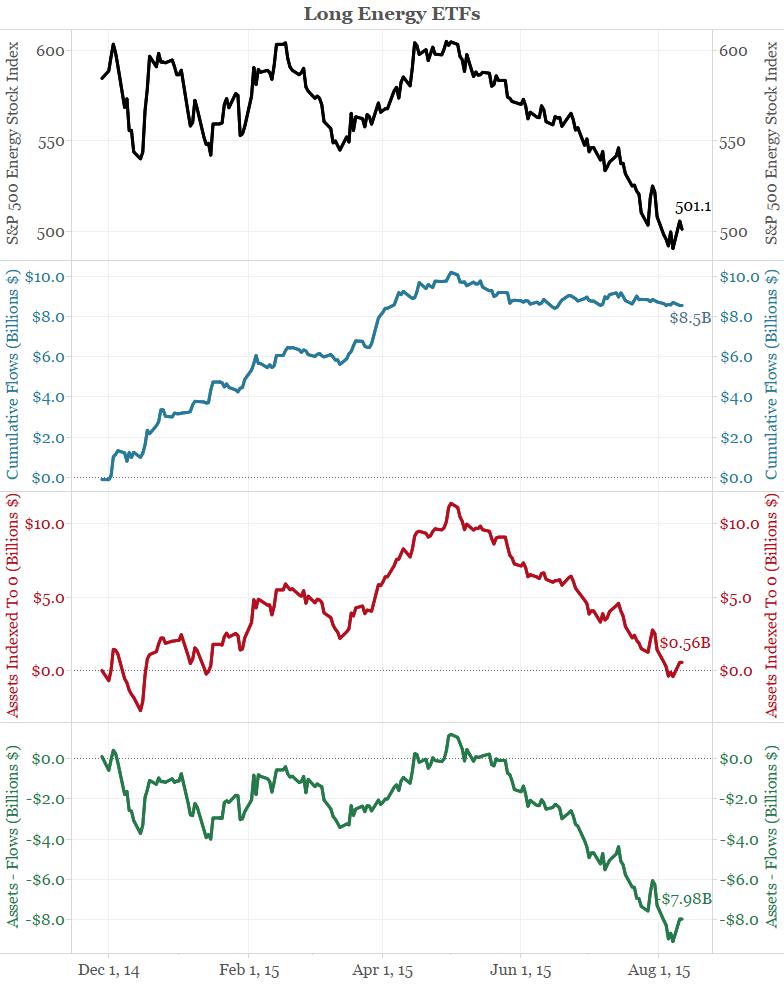
The chart below shows the same set of data for energy stock ETFs. Flows (blue line, second panel) into these funds leveled off once energy stocks peaked (black, top panel). However, traders did not add or subtract to their position as prices continued downward.
<Click on chart for larger image>
The two charts above are unique in that flows either increased or held steady during selloffs, fighting the trend of the market. This has resulted in billions of dollars of losses. Traders seem more worried about missing out on a move back to $75 than the billions they have lost betting on that move. So when will crude bottom? The contrarian would look for a real capitulation before prices could bottom. These charts suggest no such capitulation has even begun.
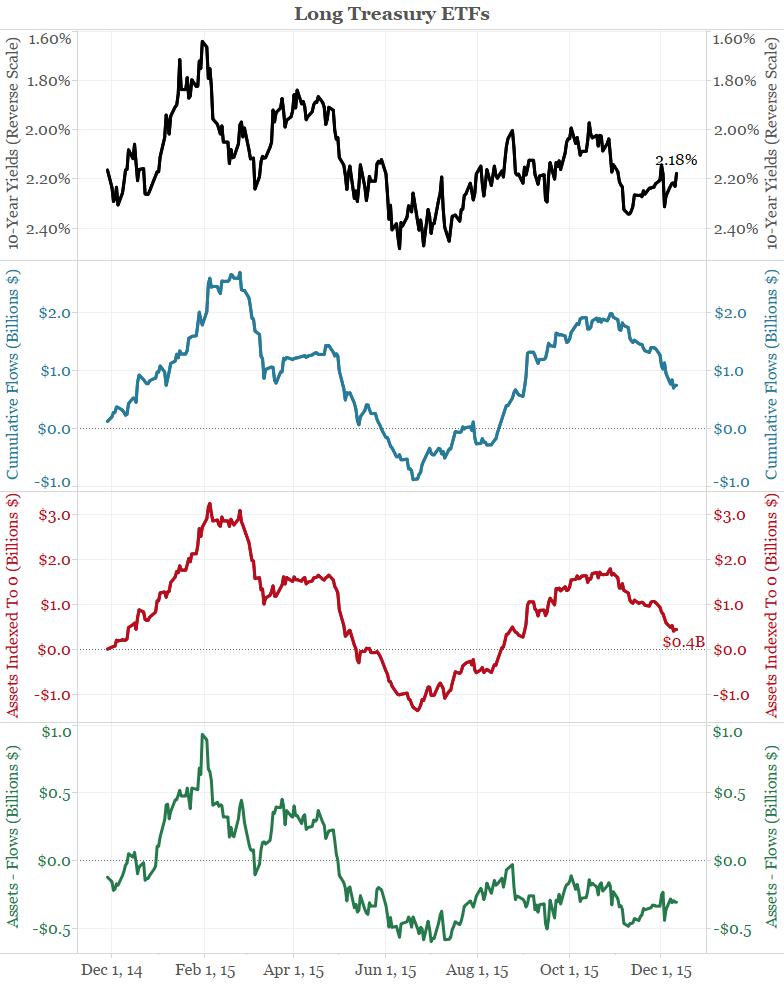
For perspective, the chart below shows a more normal relationship between flows and prices. It shows the same series as the charts above, but for U.S. Treasury ETFs.
The top panel shows 10-year yields on an inverse scale to mimic price movements. As one would typically expect, money flows into Treasury funds when prices go up and leaves these funds when prices go down. Again, this is not the case with crude oil/energy.
<Click on chart for larger image>
Yesterday crude oil futures took another beating, reaching lows not seen in many years. However, lower prices have not deterred investors from crude oil ETFs one bit.
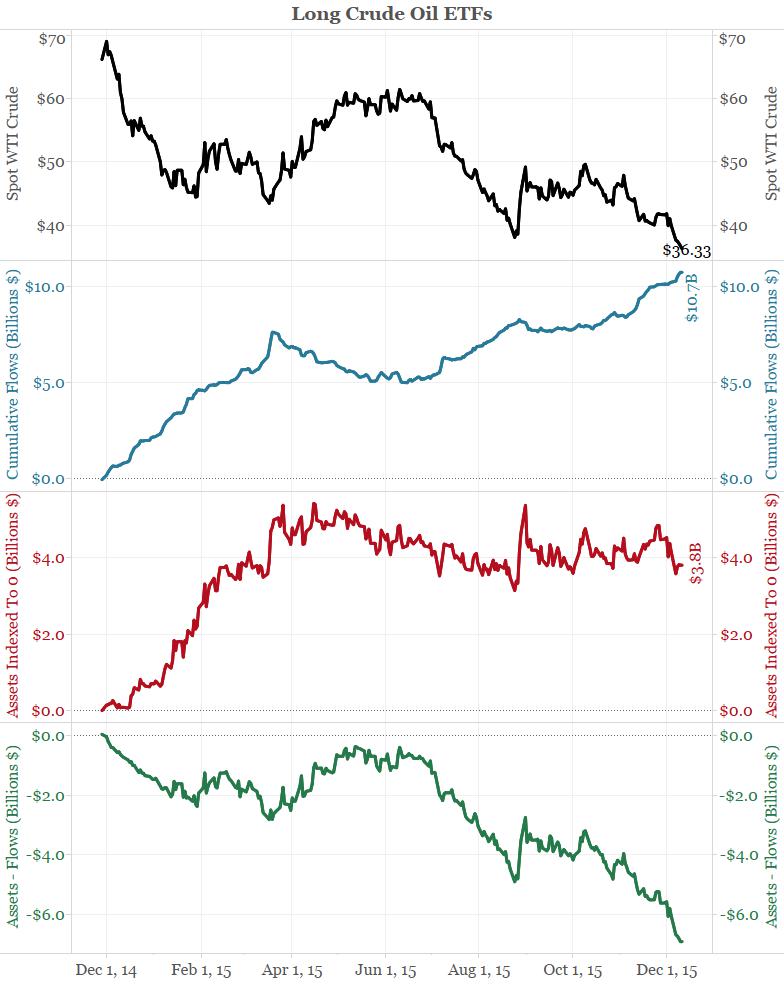
The chart below shows WTI crude oil prices in the top panel (black), the cumulative money flows into all crude oil ETFs since November 28, 2014 in blue in the second panel (blue), the change in asset levels since that same date in red in the third panel, and the assets minus flows in the bottom panel in green. This last panel is meant to give a sense of unrealized gains/losses for crude oil ETF investors since November 2014.
The striking aspect of this chart is that, as the stories above point out, money has flown into these funds (blue) as crude oil prices have fallen. As prices bottomed in late March (black, top panel), money actually flowed out of these funds. In other words, traders are trying to catch a falling knife and, as the bottom panel shows, they have failed miserably. Their losses since November 28, 2014 now total $3.3 billion (green).