- The Wall Street Journal – High-Yield Jitters Lead Some Advisers to Sell ETFs
An interest-rate rise could trigger an exodus, they say, and they are trying to get out first
Some financial advisers have been trimming their clients’ exposure to high-yield bond exchange-traded funds or cutting it altogether in recent months. They are worried that an interest-rate rise could trigger a rush for the exits that might exacerbate current liquidity issues in the market for below-investment-grade debt. After seven years of low rates, “we are in uncharted water” as to how quickly the Federal Reserve will raise rates and how quickly that will affect the value of current income holdings, says Michael Johnson, a broker with Raymond James Financial Services Inc., in Elm Grove, Wis. He says he wants to proceed carefully “and have a life vest nearby.” Low interest rates have driven investors to take on added risk in their hunt for yield. It is easy to see why they have been drawn to high-yield bond ETFs, which can yield more than 5%, compared with just 2% for an ETF investing in seven- to 10-year Treasurys. Nearly $26 billion flowed into high-yield bond ETFs from 2008 through 2014, according to Thomson Reuters Corp. ’s Lipper unit. Another $1.09 billion has flowed into the funds this year through July 22, bringing their assets to $37.8 billion, Lipper says. Those investors have flooded in as Wall Street securities firms have had to rein in their risk-taking, including their bond buying, as a result of the Dodd-Frank Act. Their reduced involvement has raised fears that buyers could dry up if a short-term interest-rate increase by the Federal Reserve prompts bond investors to flee.
Comment
The next two charts show high yield and investment grade credit spreads both hit their narrows over a year ago (June 2014) and are currently making new wides.
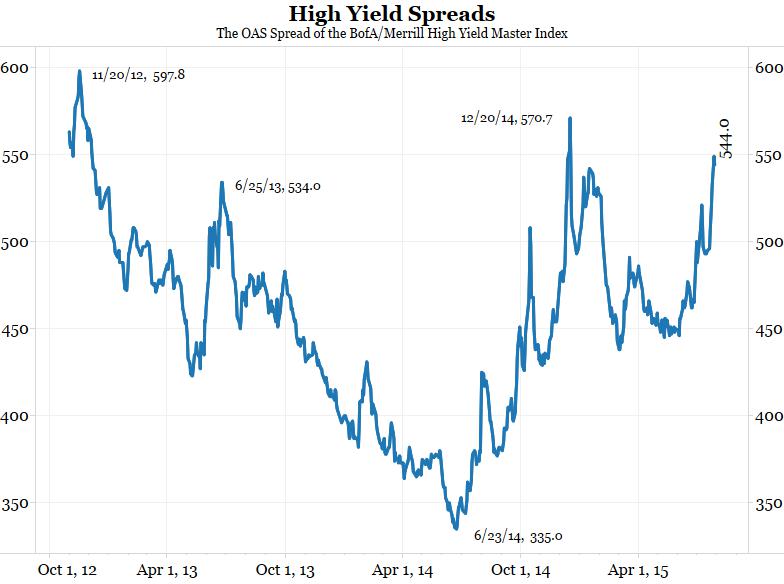
<Click on chart for larger image>
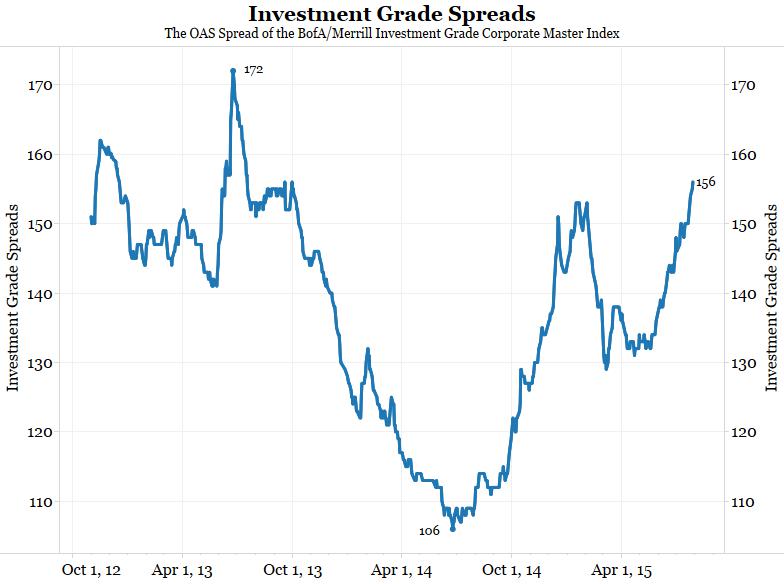
<Click on chart for larger image>
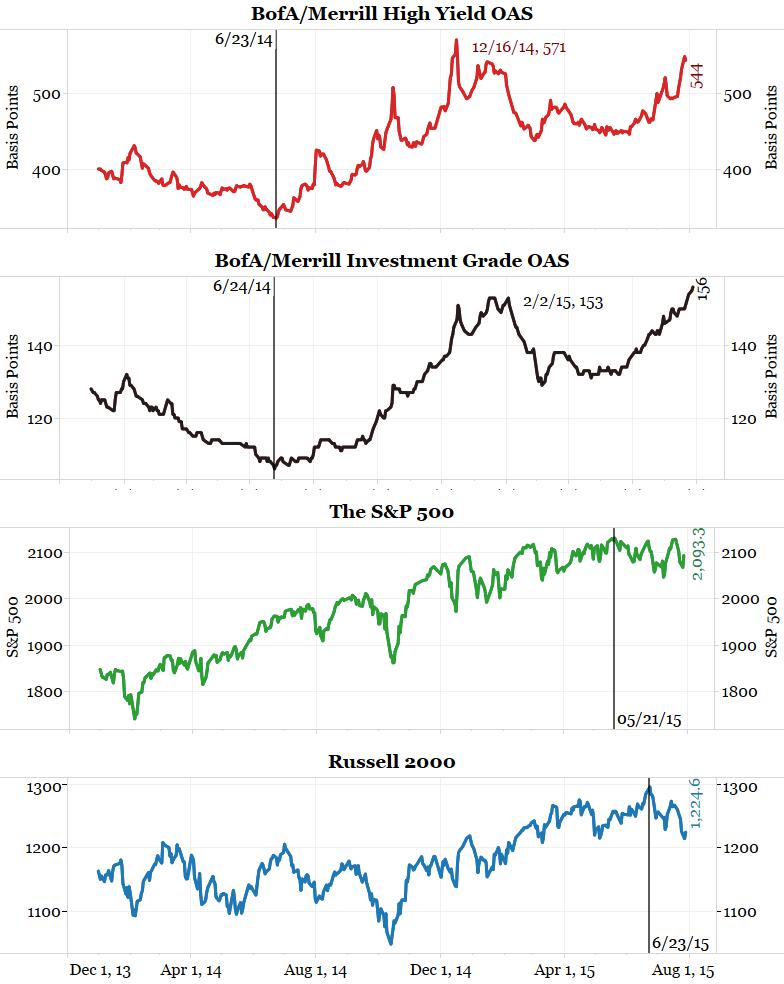
The next chart shows how credit spreads compare to the stock market. It’s been over a year since spreads hit their narrows (first two panels), but stock prices continue to power higher through this summer (and may not be done).
<Click on chart for larger image>
The next chart shows the economic bottom in 2008/2009 (shaded area = Great Recession). The first two panels show credit spreads peaked first, months before stocks.
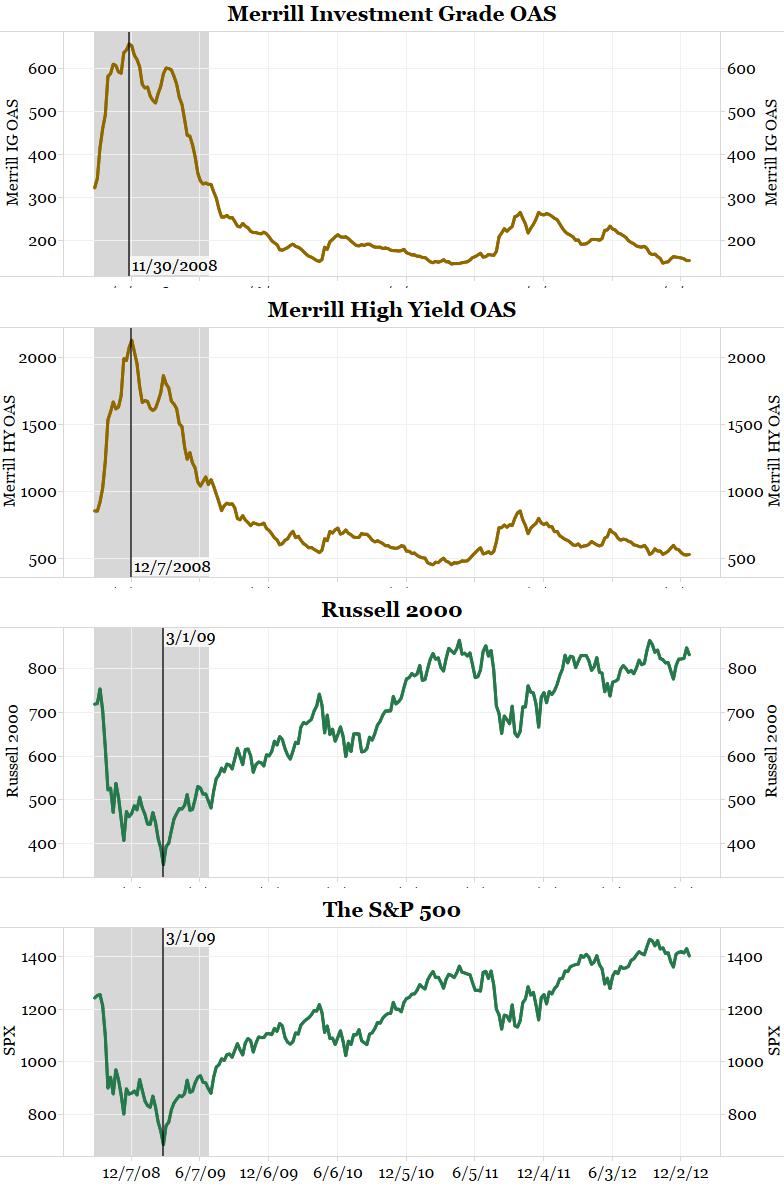
<Click on chart for larger image>
The next chart shows the economic top in 2007 (shaded area is the beginning of the Great Recession). Credit spreads hit their narrow months before the stock market.
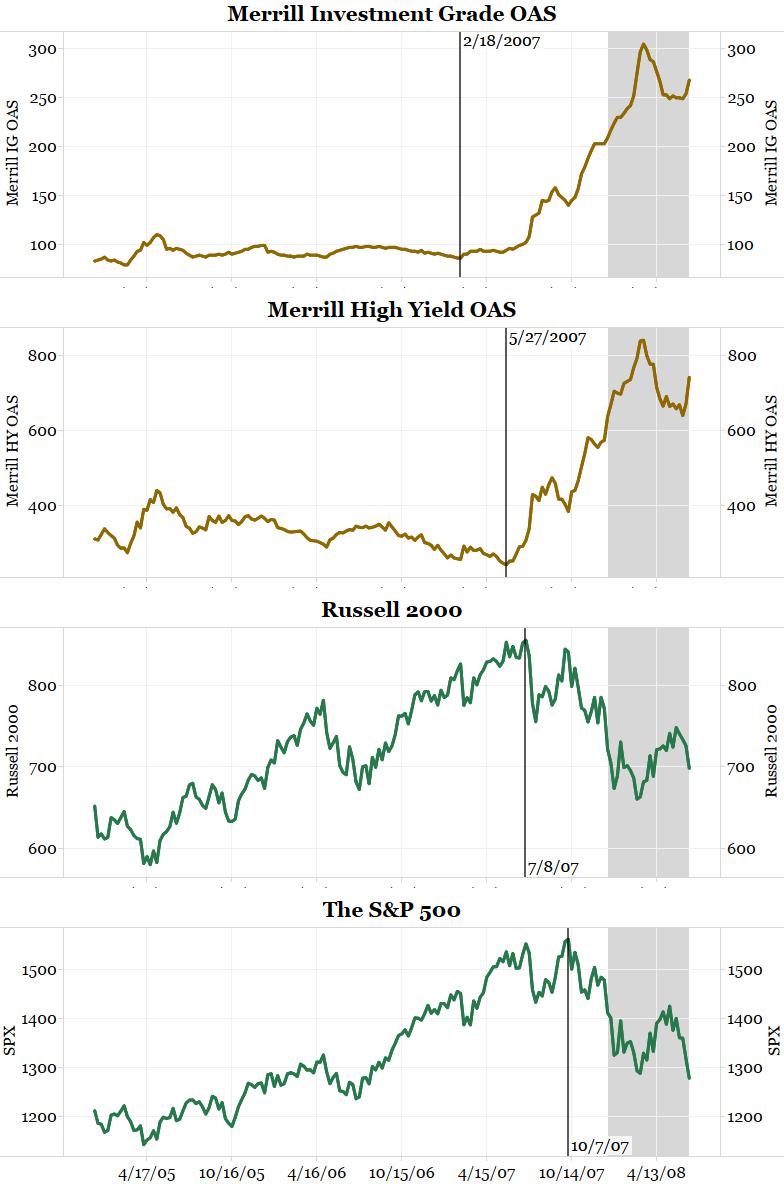
<Click on chart for larger image>
Finally, the last chart shows the markets around 2001. In 1999 credit spreads hit their narrows months before stocks and the 2001 recession (shaded area).
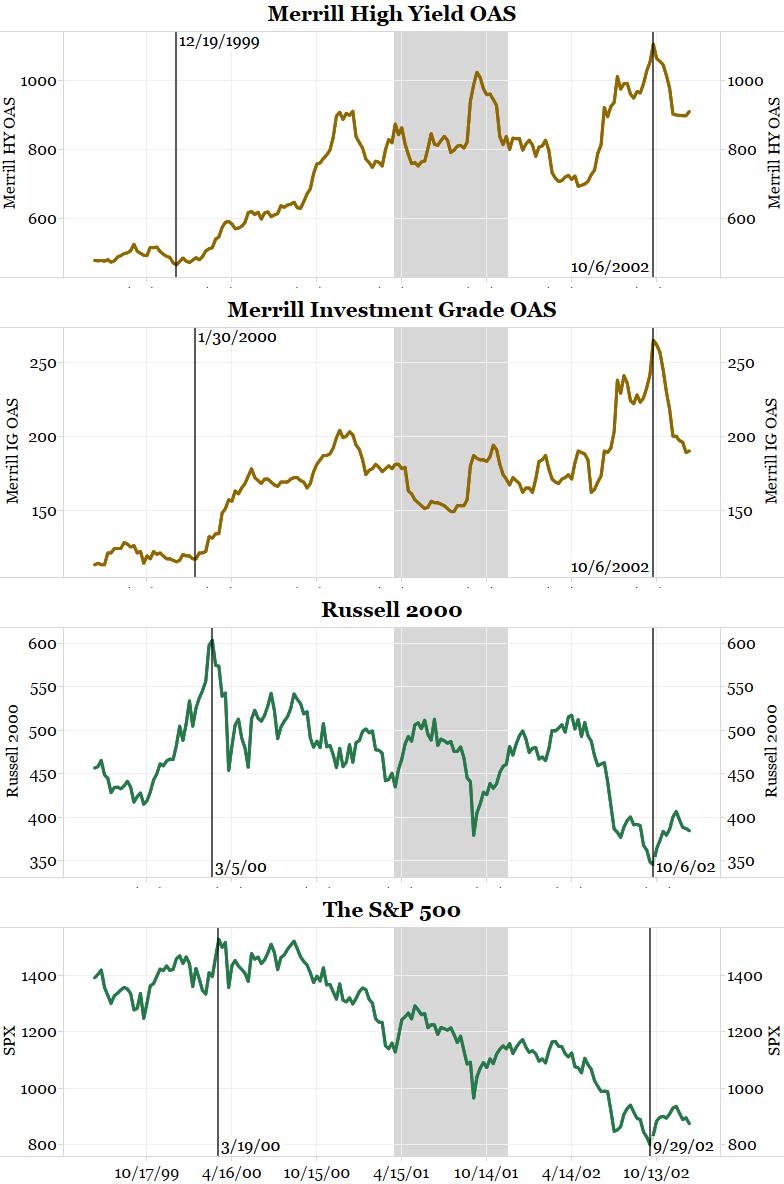
<Click on chart for larger image>
Interestingly, credit spreads and stocks both bottomed at the same time in October 2002, 11 months after the recession ended. As the next table shows, this was only the second time in the last 115 years that the market “turned” after the recession ended (the other one was 1921).
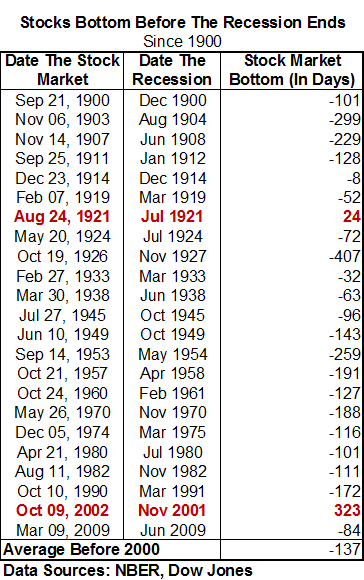
<Click on table for larger image>
Credit spreads led both equities and the economy over the last two recessions and the last four economic turns. The fact that credit spreads bottomed over a year ago and continue to widen could be considered a warning sign for both the economy and the stock market.