- Barrons – Gold Is Falling So Hard It Looks Like Capitulation
Gold is a falling knife. I am not advising investors try to catch it. The trend is down, and as of today a fairly sizeable technical pattern is broken to the downside. But there is something intriguing now about the yellow metal, and it has everything to do with fear. Investors seem to be willing to dump their gold holdings en masse even at already depressed levels, following the perceived lead of China, which reported last week that it wasn’t holding as much gold as originally thought. It is ironic that gold, recently trading at a 5-year-low just above $1,100, is supposed to be the hedge investors use when they are fearful about other things, such as the economy. But right now, the fear is for gold. Never mind that central banks around the globe have been selling gold for years…I will watch for a sharp rebound here and possibly even a follow-through day signal that is often found in the stock market. In a nutshell, the signal looks for a surge in price and volume about a week into the rebound attempt. It seeks to avoid falling for oversold bottom fishing moves and jump back into a market when there is proof that demand has come back. Another sign would be found in the Commodity Futures Trading Commission’s commitments of traders report, to be released next week. It will be interesting to see if speculators continue to press their bearish views while commercial hedgers pivot more to the bullish side. But for that, we will have to wait. The bottom line is that, with fear in the air and blood in the streets, gold and related markets may be in the final stages of their bear markets. Once the turn is made, whether it is this month or later this year, there should be ample technical evidence in place to tell us. But for now, a bottom it is still an unproven theory.
Comment
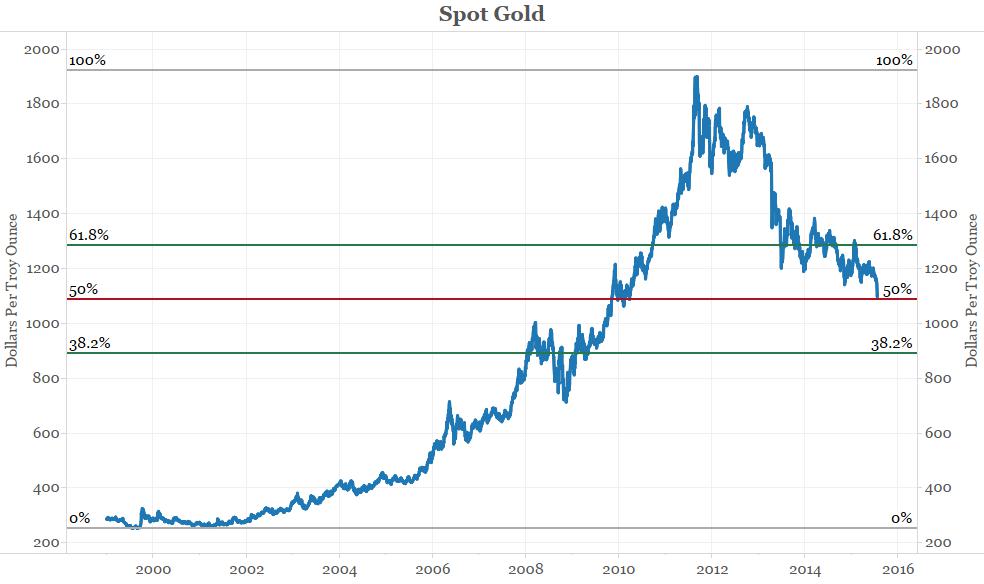
<Click on chart for larger image>
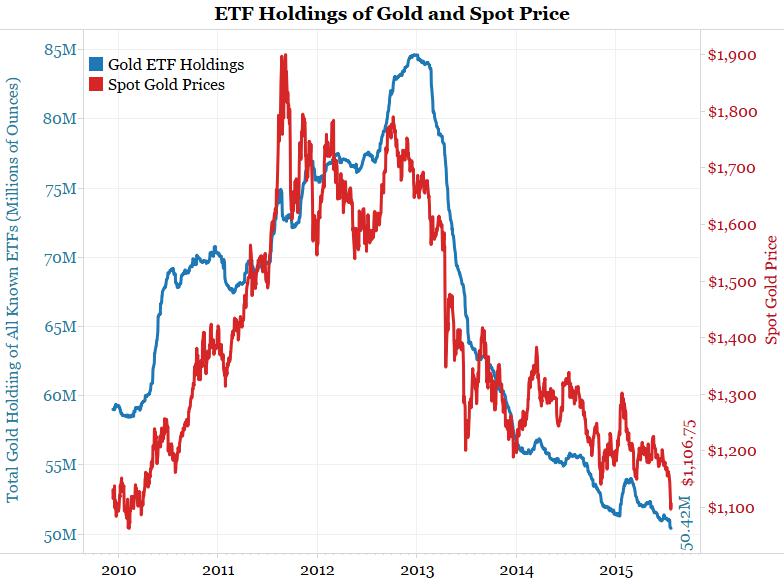
Second, much of the speculative money has already left the gold market. As the chart below shows, gold ETF held almost 85 million ounces of bullion at their peak. Now they hold roughly 50 million ounces. Once holdings bottom out, all the short-term, weak-handed speculators have been shaken out of gold ETFs. This would signal a bottom in prices. It’s too early to confidently predict a bottom in holdings, but this week’s price action has undoubtedly shaken out many of the weak-handed speculators.
<Click on chart for larger image>
To further the case that speculative money does not think too highly of gold right now, consider the chart below. As we pointed out Monday, money managers are actually net short gold futures for the first time since the Commitments of Traders disaggregated data series began in 2006.
<Click on chart for larger image>
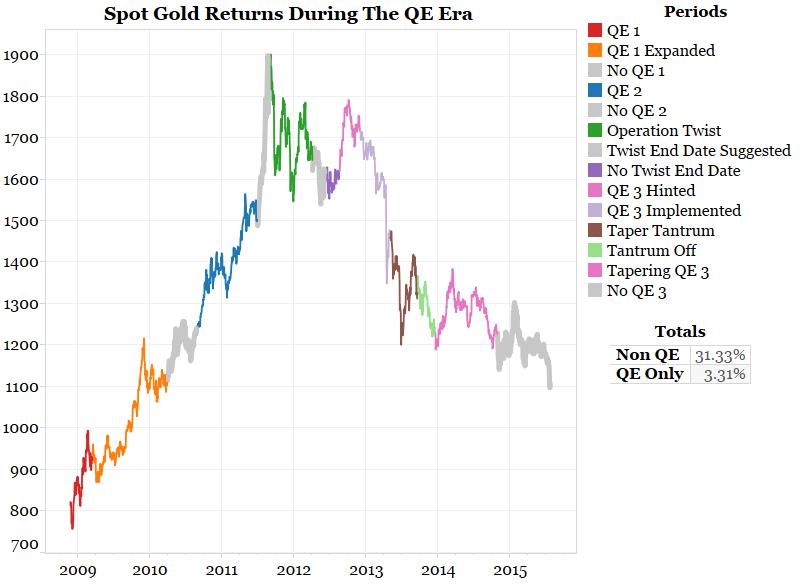
Finally, consider gold’s returns during both QE periods and a non-QE periods. As the chart below shows, gold has fared much better during non-QE periods than it has during QE-periods.
<Click on chart for larger image>
The charts above are largely measures of market sentiment. While this type of data is not necessarily meant to be used as a market-timing tool, a bottom in gold may not be far in the offing.