- Reuters – Oil rallies as hedge funds are caught short: Kemp
Oil’s sharp rally since the middle of March has been driven by a race among bearish hedge funds to cover loss-making short positions rather than any great bullishness about the outlook. On the eve of the rally, hedge funds and other money managers had amassed record short positions in WTI-linked futures and options amounting to 209 million barrels of oil. But in the seven weeks between March 17 and May 5, hedge funds cut their shorts by almost 116 million barrels to 93 million, a decline of more than 55 percent. Over the same period, hedge funds added only 7 million barrels of net new longs, a 2 percent increase from 381 million to 388 million, according to the U.S. Commodity Futures Trading Commission (CFTC). Hedge fund short covering coincides almost precisely with the rise in front-month WTI prices, from a recent low of $42 per barrel on March 18 to a high of more than $62.50 on May 6, an increase of nearly 50 percent.
Comment
<Click on chart for larger image>
Many are simply getting caught up in the fact that crude oil has rallied nearly 50% in the past couple months while forgetting how far prices fell to begin with. Such quick moves are often associated with short squeezes. As the story above states:
hedge funds and other money managers had amassed record short positions in WTI-linked futures and options amounting to 209 million barrels of oil. But in the seven weeks between March 17 and May 5, hedge funds cut their shorts by almost 116 million barrels to 93 million, a decline of more than 55 percent. Over the same period, hedge funds added only 7 million barrels of net new longs, a 2 percent increase from 381 million to 388 million, according to the U.S. Commodity Futures Trading Commission (CFTC).
Frankly, in this case the CFTC data mentioned above should not be analyzed on a long-only or short-only basis. It should be viewed on a net basis.
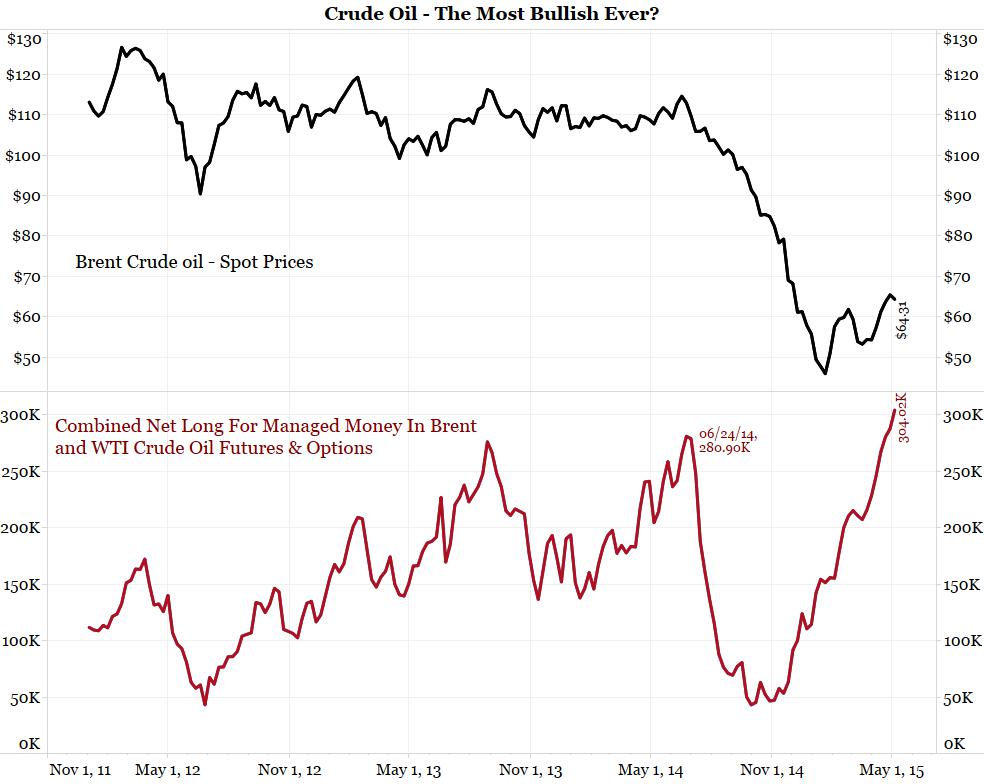
The red line in the second panel below shows the combined net long position in both Brent and WTI futures and options among money managers. This group is the largest speculative category and they are now at a new record net long position.
This chart shows the opposite of a short squeeze. It shows a speculative frenzy to get long.
<Click on chart for larger image>
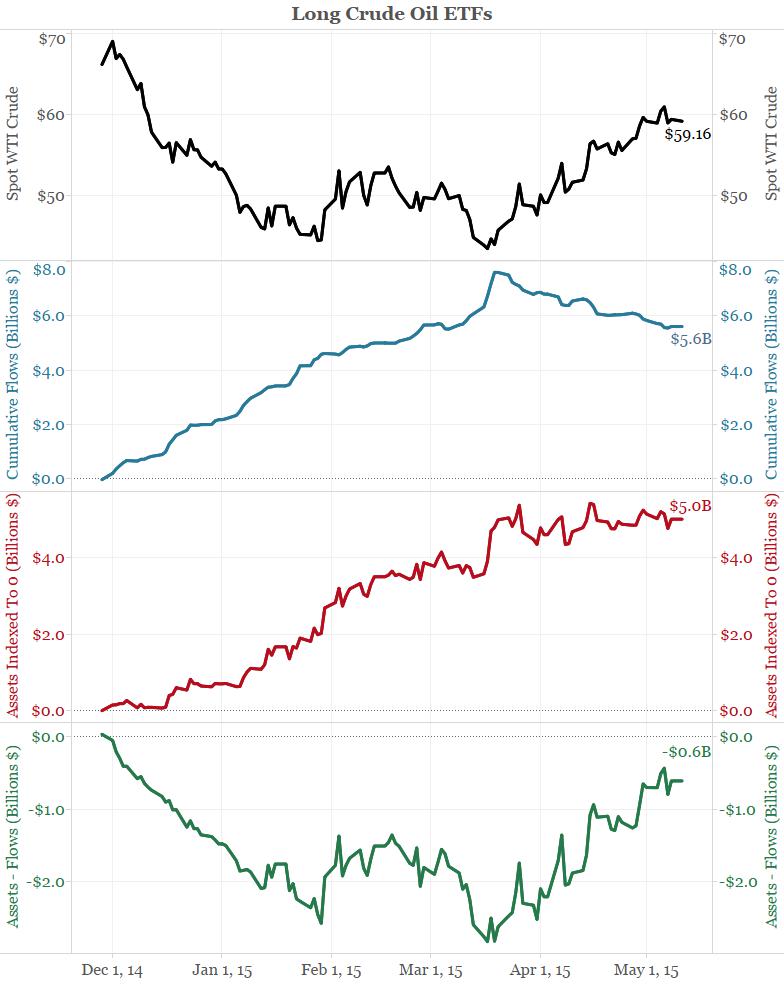
The chart below shows the speculative frenzy is also occurring in crude oil ETFs. It details the difference in growth between flows in blue and asset levels in red since November 28, 2014. The green line in the bottom panel shows the difference between assets and flows over this period. In other words, this line shows the profit/loss incurred by crude oil ETFs over this period.
Since November 28, long crude oil ETF buyers plowed about $5.7 billion into 24 different crude funds. However, assets have increased by $5.2 billion. So these investors, by buying through the collapse and a 40% rally off the low, are still roughly $500 million underwater. Restated, these are very weak hands that are still sitting on losses.
<Click on chart for larger image>
So why are we making a big deal about this?
So much of investing/trading is based on folklore. After reading many times that crude is up 40% or 50% in two months, you would be forgiven for concluding that there must be a massive short squeeze going on. This is simply not the case with crude oil right now.
To be blunt, we view this story as completely wrong. It seems to start with the premise that crude oil prices are rising on a short cover and tortures the data to confirm that conclusion.
As we noted last week:
During the height of the financial crisis in October 2008 the financial media was tying itself in knots because stocks were vacillating between a correction (10% decline) and a bull market (20% advance) about every four days. In other words, they could not adjust to the heightened volatility and acted as if every day brought a new bull market or major correction.
The same is now happening with crude. 20% to 30% moves have become common. But as we read the tone of the story above, each one of these moves should be looked at as a breathless opportunity. Crude has moved more than 4% on 24 different days already this year. How would you view the stock market if the DJIA moved at least 500 points 24 different times this year? That is the volatility we have seen in crude.
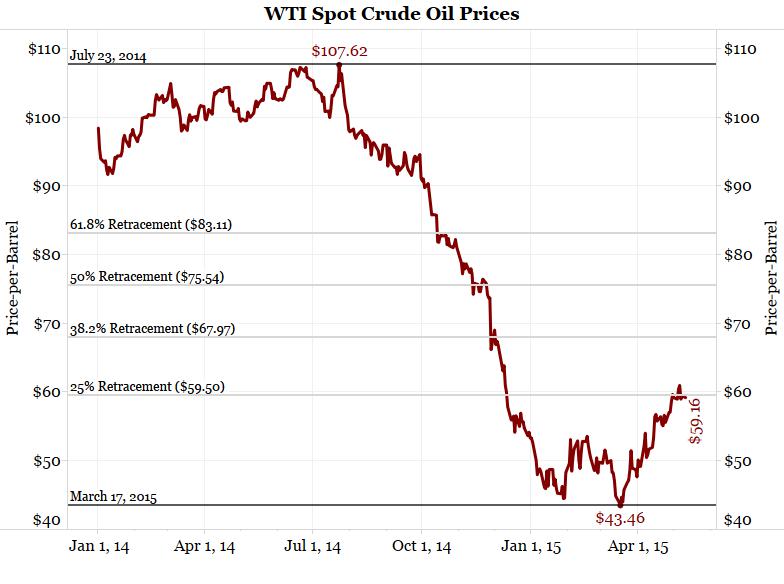
See the chart [below]. Crude oil has only retraced 25% of its July-to-March decline. Technical analysts will tell you any market can retrace 38.2% while still maintaining its trend. As noted on the chart above, WTI can trade to $68 and its downtrend is still in tact. Even if it trades above $68, the trend is only in question. Only if it goes to $75 to $80 can the trend be described as up.
Crude prices have simply retraced 25% of their July-to-March decline. According to technical analysis, the downtrend is still intact.