- The Wall Street Journal – Apple and the Art of Guidance
CEOs and their finance chiefs are in a tight spot this month as they report quarterly financial data, aiming for a delicate balance of realism and optimism.The art of guidance is always a delicate dance between realism and optimism, but a misstep in these febrile times can lead to a fall. Anything cautious that a CEO or CFO says about consumer demand, supply chains, inventory or credit conditions could be read as proof the sky is falling. When making predictions about the economy, “you don’t want to be the guy that sticks his head above the water and all the sudden, two months later, have The Wall Street Journal writing about how wrong your comments were,” said Ken Goldman, Yahoo’s former CFO.
Summary
Comment
This week the Q4 2018 earnings season gets underway. Since corporate tax cuts took effect on January 1, 2018, this will mark the last quarter that benefits from a jump in earnings over the previous year. Because of this, many will be less interested in actual Q4 results and more interested in guidance for 2019.
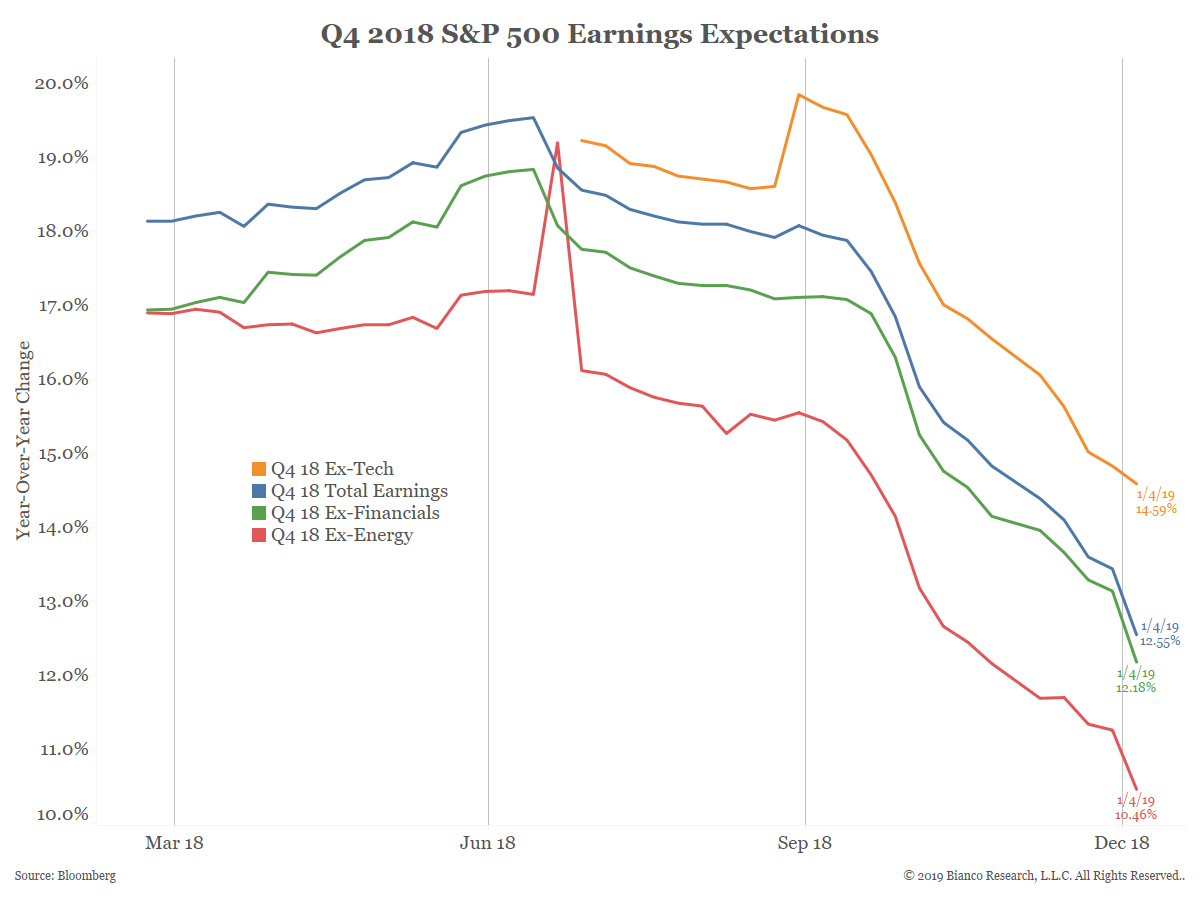
The chart below shows weekly estimates for Q4 2018 S&P 500 earnings growth are falling hard. As of January 4, however, analysts are still expecting double-digit growth rates.
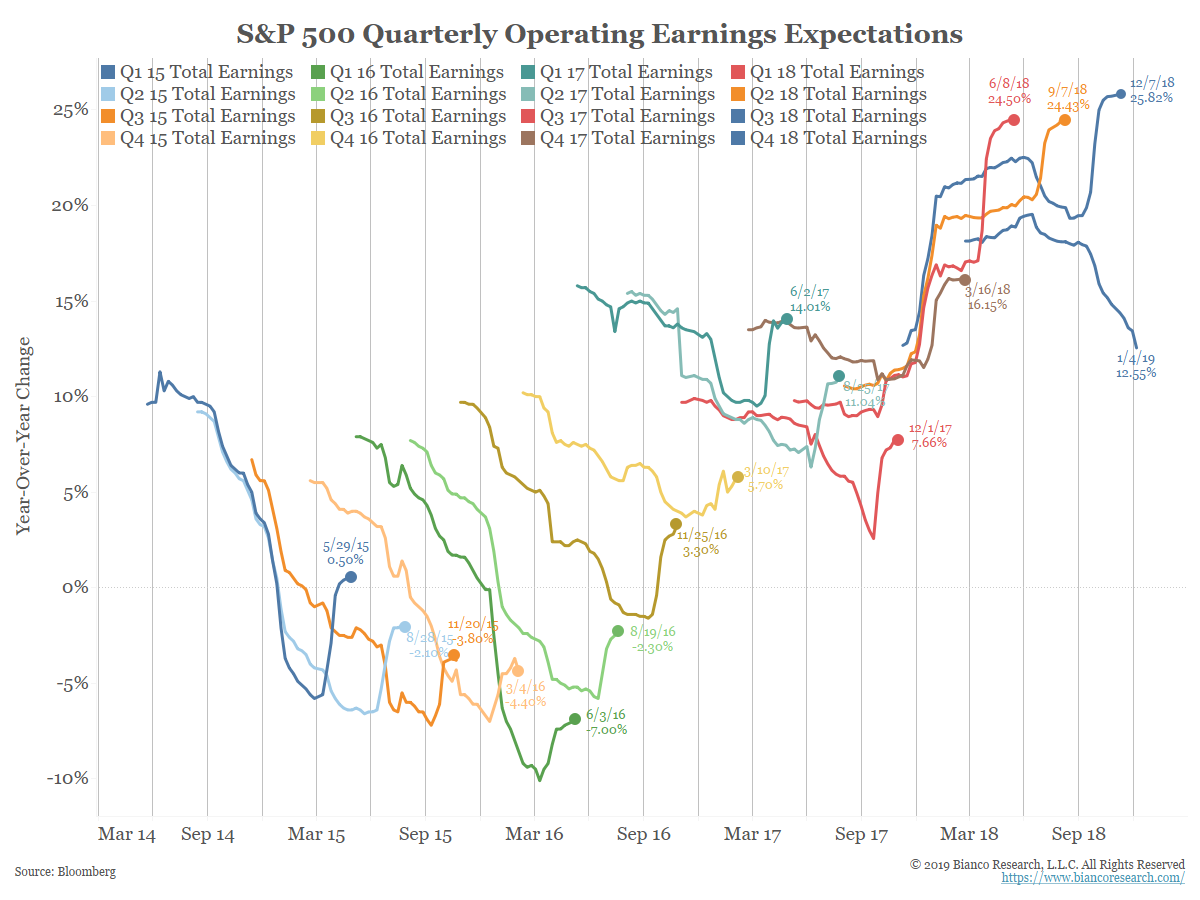
The next chart shows the last sixteen quarters of earnings estimates. Each series starts as an average of 500 estimates. As companies report, the estimate is replaced with the actual result.
Before 2018 the pattern was predictable. Earnings estimates started off too high and were lowered heading into earnings season. Once earnings season started (vertical line) and actual results beat estimates, growth rates bounced higher.
This pattern broke in 2018 (rightmost red, orange, and blue lines) as earnings rose into the end of the quarter and then bounced higher. This was largely due to the corporate tax cuts.
The estimates for Q4 2018 have returned to this pattern of falling prior to results being released. We still expect to see the typical bounce as earnings season gets underway, leading to a final growth rate above the current estimates of 12.55%.
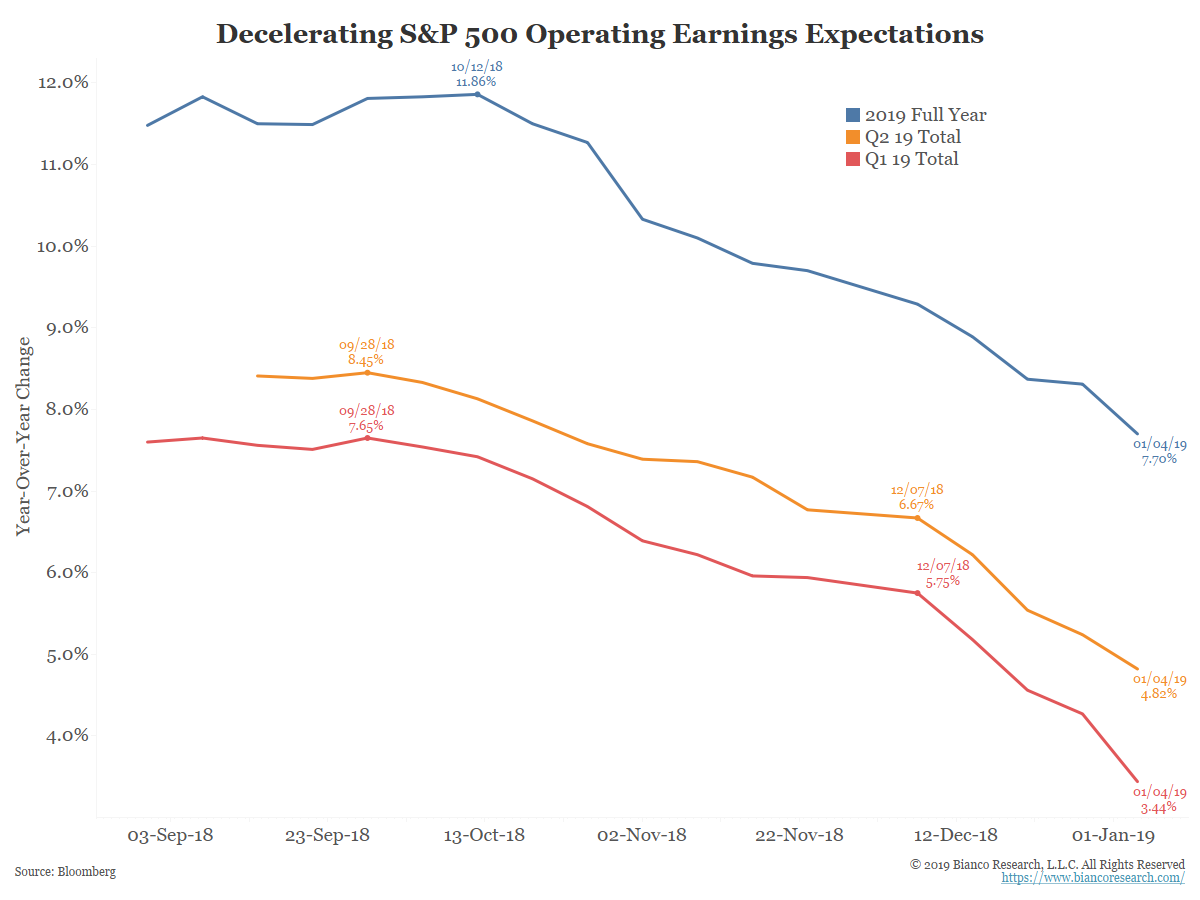
It would be difficult to categorize a 12%+ growth rate as anything but positive. However, as the next chart shows, earnings estimates are expected to be much lower in 2019. Q1 estimates (red) are under 4% while Q2 estimates (orange) are under 5%. Full-year 2019 earnings estimates (blue) are under 8%. While these numbers are lower across the board, they still have plenty of time to head even lower.
Analysts will be watching these 2019 figures closely. While the Q4 2018 numbers should prove positive, any guidance offered for 2019 will affect the chart below immensely.