- MarketWatch – Caroline Baum: What’s propelling stocks higher? Not the Fed’s balance-sheet expansion
Ultra-low interest rates in the developed world play a bigger role than the Fed’s Treasury bill purchases
The idiosyncracies of the Fed’s balance sheet seem more arcane and less relevant to the average investor than the well-publicized benchmark rate. So if there’s a motivator for the stock market rally, the persistently low level of interest rates, not the expanding balance sheet, would seem to be the more likely culprit.
Summary
Comment
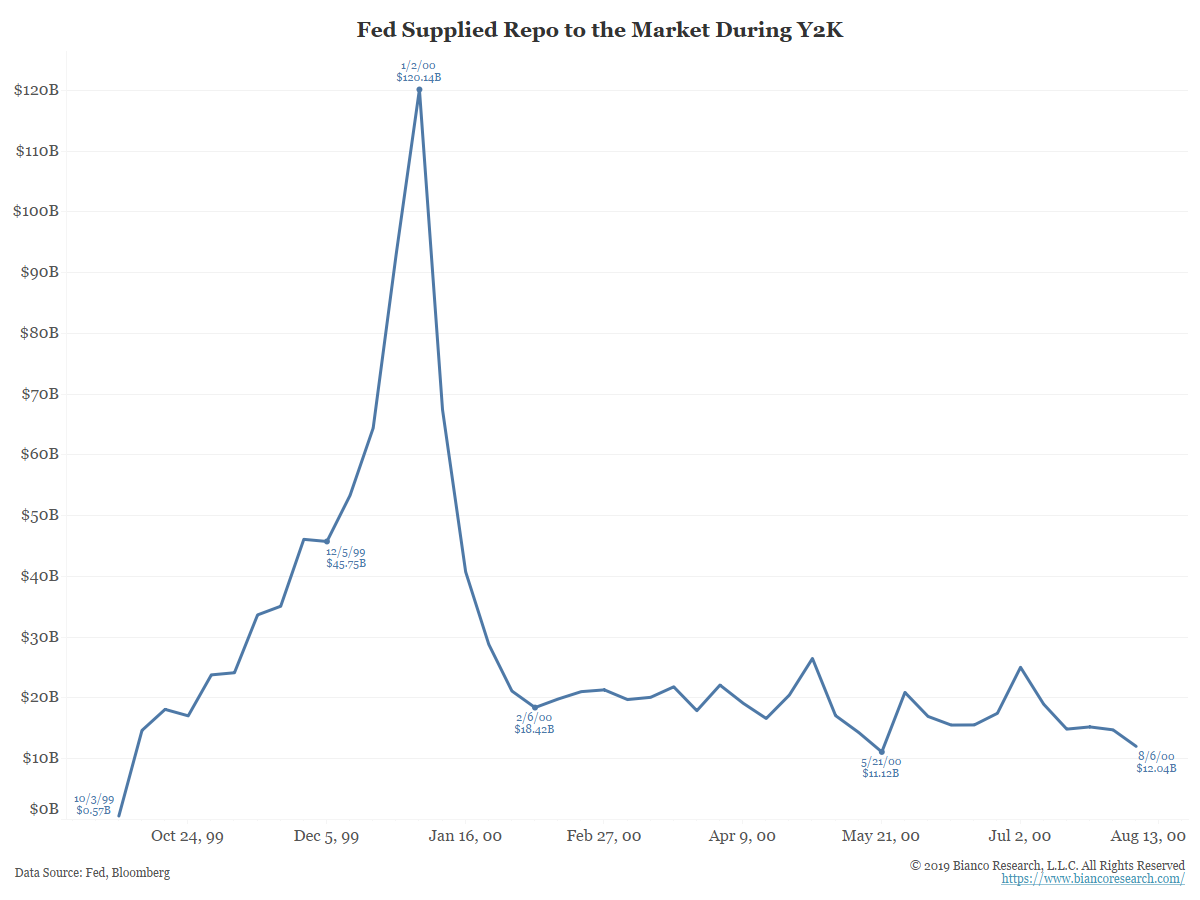
We would argue the special lending facility that started in late 1999 to support the feared Y2K computer glitch offers a historical analogy to the current period.
Stories 20 years ago sound like they are describing what is happening today:
- Dow Jones News Service – (December 28, 1999) CASH IS FLOWING LIKE CHAMPAGNE FOR Y2K
The volume of cash that the Federal Reserve has temporarily given to banks to avert potential Year 2000 strains is rising to dizzying levels. Including nearly $20 billion it gave to the banking system in the form of term “repurchase” agreements Monday, the Fed has almost $100 billion in hard currency loans outstanding to banks. That’s the most money lent out through repurchase agreements ever, said Peter Bakstansky, spokesman for the New York Federal Reserve. For some perspective, the Fed had $23 billion in outstanding “repos” in December 1998, and around $9 billion in December 1997.
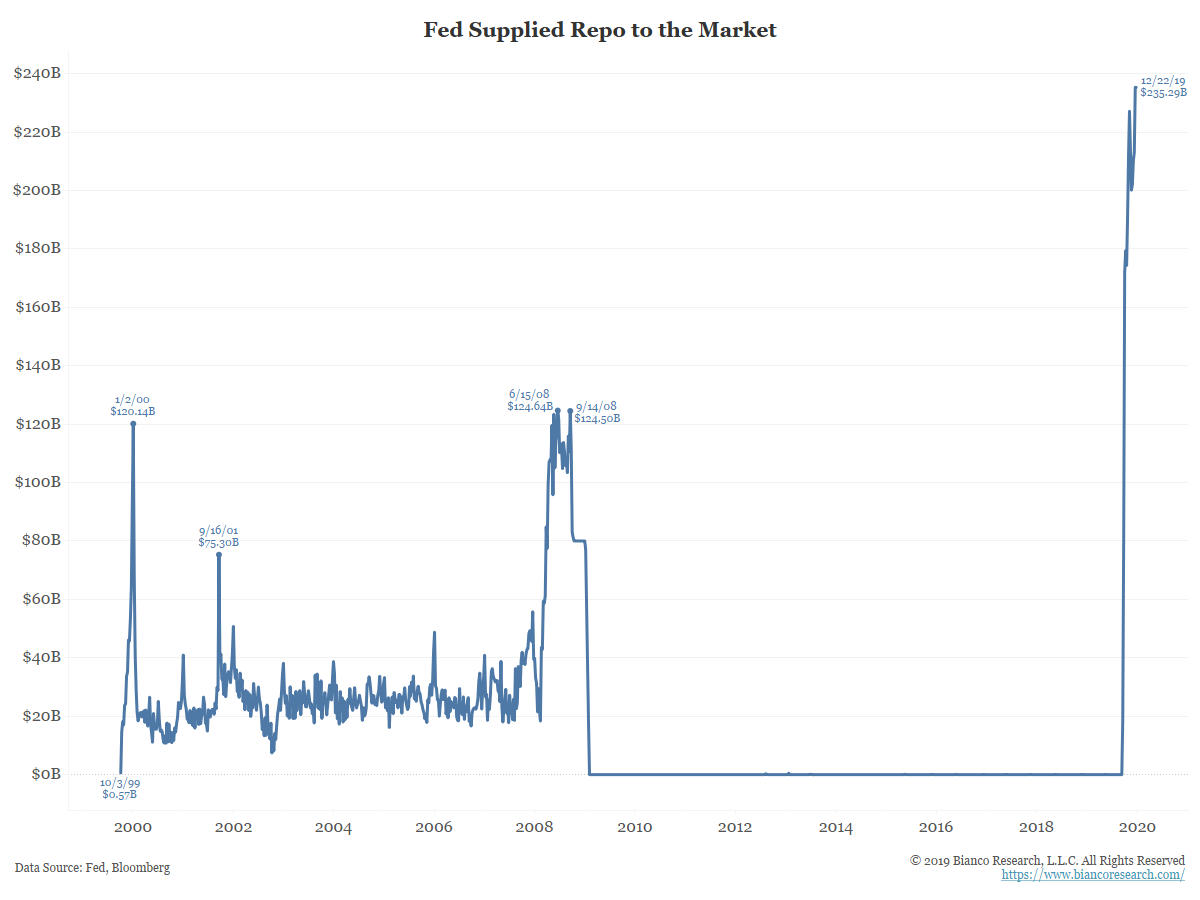
In fact, the amount of repo the Fed supplied in late 1999 was significantly more than on 9/11 and on par with the support offered during the financial crisis.
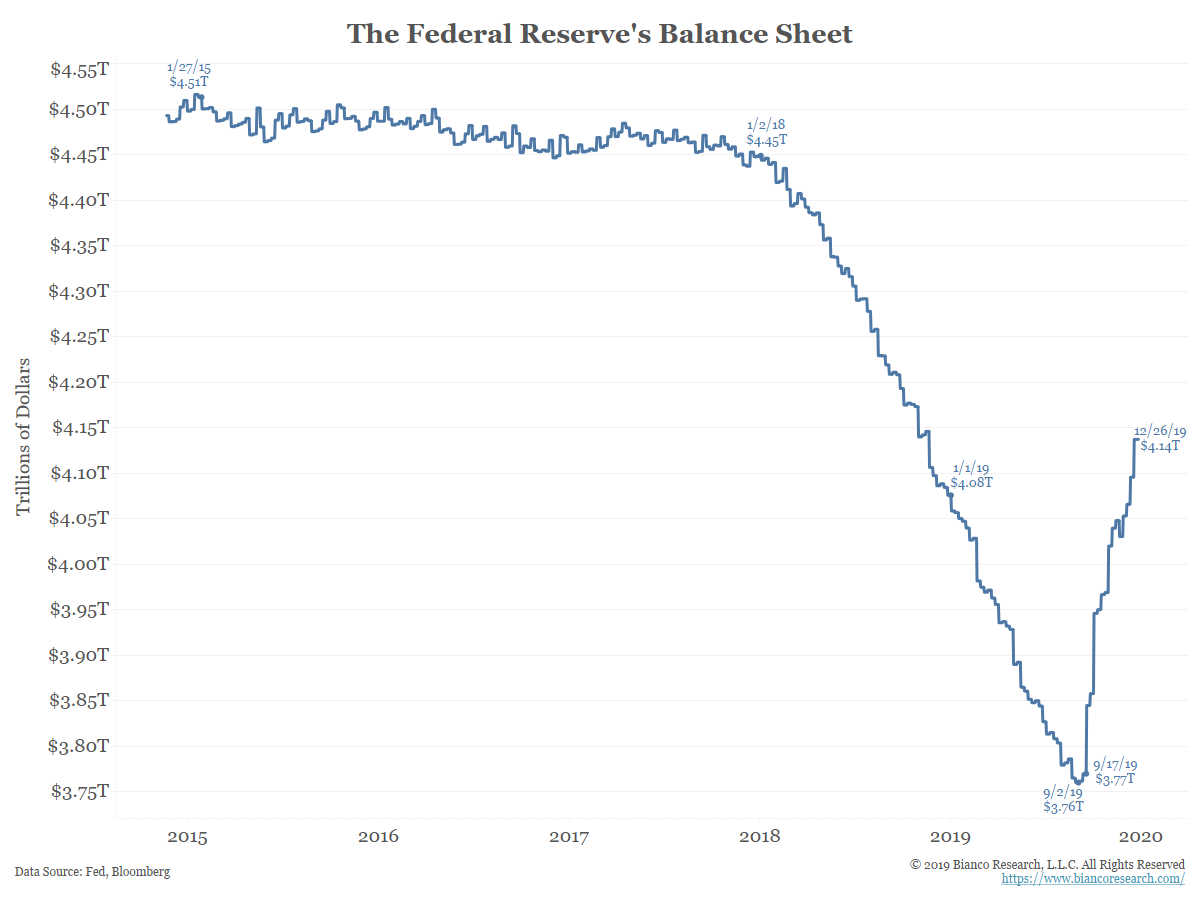
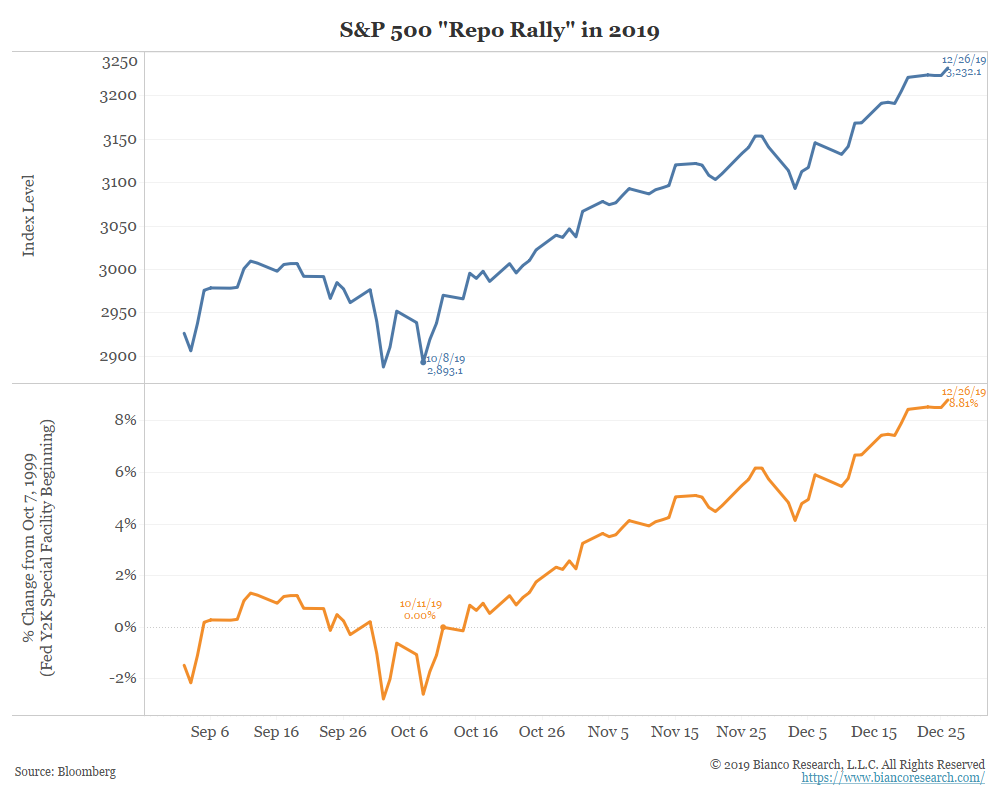
It was not until September 2019 that the Fed’s repo operations finally saw a meaningfully higher level.
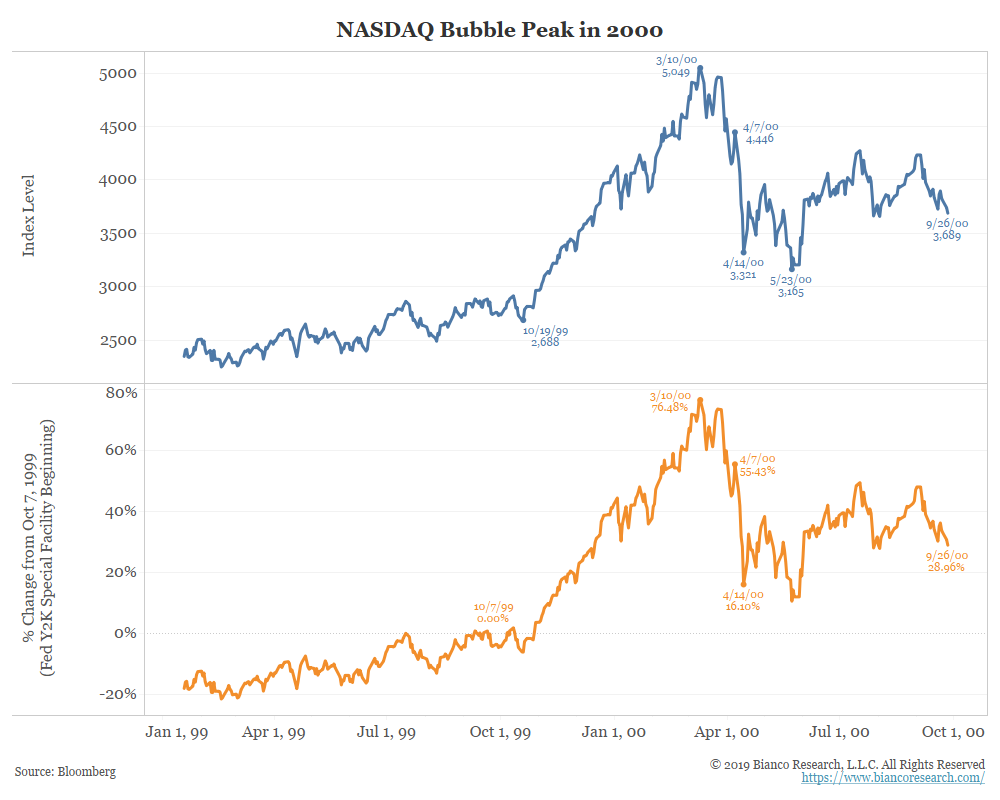
Note that the Y2K special lending facility ran from October 7, 1999, to April 7, 2000. And what did stocks do during this period? Below is the NASDAQ.
It went on a tear rarely seen in American finance, starting literally the day the Fed opened its Y2K lending facility. It crashed 25% the week the facility closed (April 7, to April 14, 2000).
Conclusion
There is no such thing as a one-factor model to explain the stock market. Metrics such as the Fed’s balance sheet, repo, etc. cannot explain the stock market’s movements in isolation.
That said, when the Fed injects money, funds generally flow to the best-returning market. During the financial crisis, it was the bond market. Today, as was the case in 1999, it is the stock market.
There have been indications of how important the Fed’s balance sheet is to financial flows in the recent past.
During the Fed’s Dec 19, 2018 presser, the stock market collapsed when Powell said the balance sheet was on “automatic pilot.” It soared almost a 1,000 DJIA points on January 4 when he said the Fed would be “patient and flexible.” On June 4, when he said the Fed would “act as appropriate,” stocks continued higher. Again, no single measure can predict the stock market, but these were clear signs that the size of the Fed’s balance sheet and policy matter.
The following table highlights this. Through June 5, half the gains to that point came on the two days Powell commented on policy.
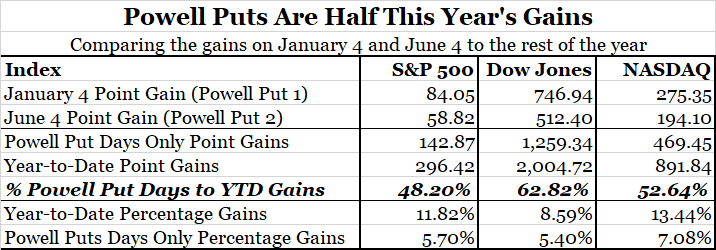
Another 9% of the stock market’s gains came after October 11, when the Fed announced its T-bill purchase problem. So, a big part of this year nearly 30% stock market gain has come on the heels of Fed moves, much like last year’s 20% decline was coincident with the Fed’s hawkish rhetoric.
Given all this, the big question is, what happens when the Fed ends T-bill purchases and repo support in Q2 (the current projected end date)? Will the April 2000 analogy apply?