- Bloomberg – Don’t Bet Against the Fed’s Rate Forecast
The central bank is likely to stick to three hikes in 2018.
In short, don’t yet bet against the Fed’s 2018 rate forecast from either side. The current pace of economic activity will keep the Fed focused on rate hikes even with inflation on the low side. I have trouble seeing central bankers ease up on the brakes as long as job growth remains sufficiently high to put downward pressure on unemployment. Likewise, a central bank with a symmetric inflation target should not overreact to inflation. This is especially the case in the Fed’s current situation, given that officials think a faster pace of rate hikes risks a recession. They would need to see clear reason to take on such a risk. For now, the current strength in the economy points more toward another 75 basis points of rate hikes in 2019 than an acceleration of the 2018 pace.
Summary
Comment
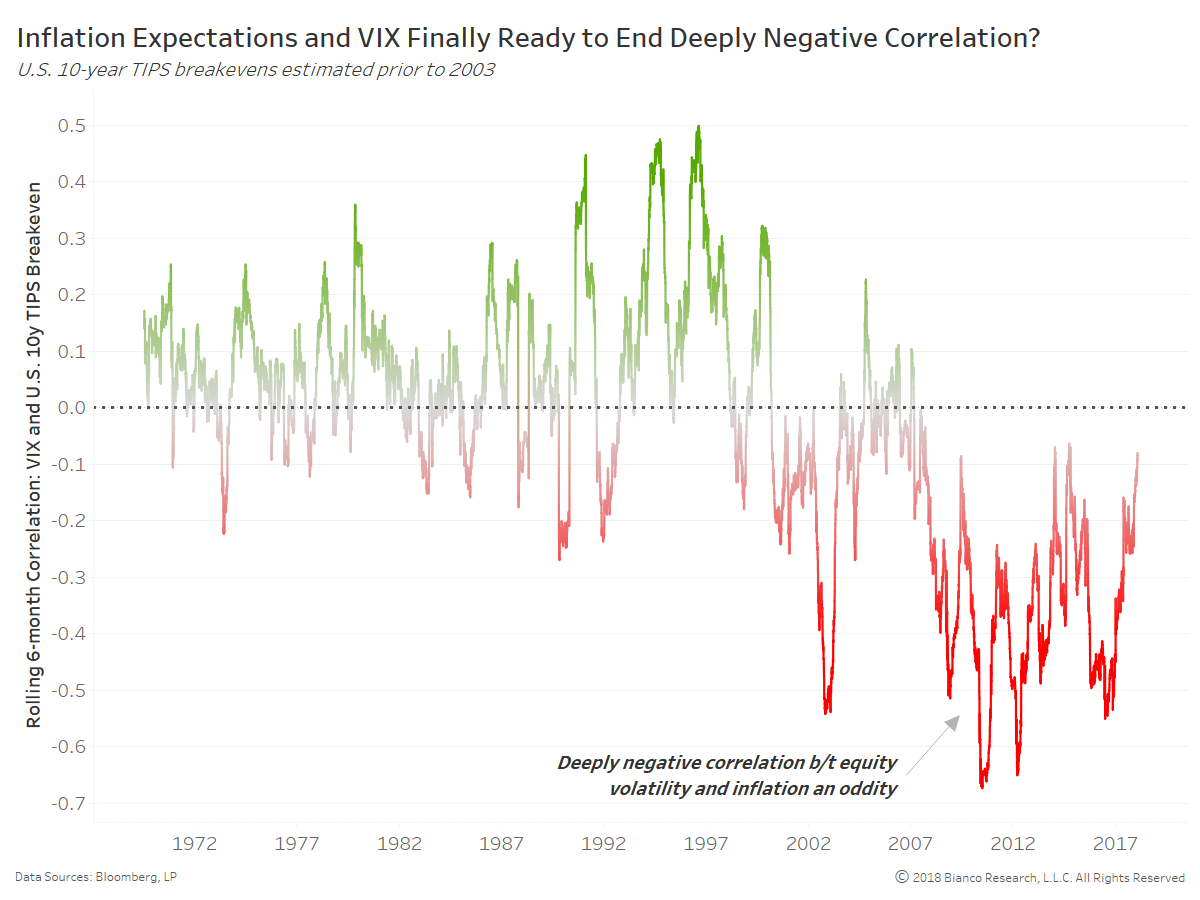
Last week we highlighted the potential for positive correlation between financial market volatility (risk and safe assets) and inflation expectations for the first time since pre-crisis. In other words, rising inflation would no longer offer a boost to equities found in the S&P 500 and Stoxx 50.
The chart below offers a more distant look-back at the rolling six-month correlation between the VIX (S&P 500 implied volatility) and U.S. 10-year TIPS breakevens (inflation expectations). The deep negative correlation plaguing the post-crisis time period is truly an oddity compared to decades past.
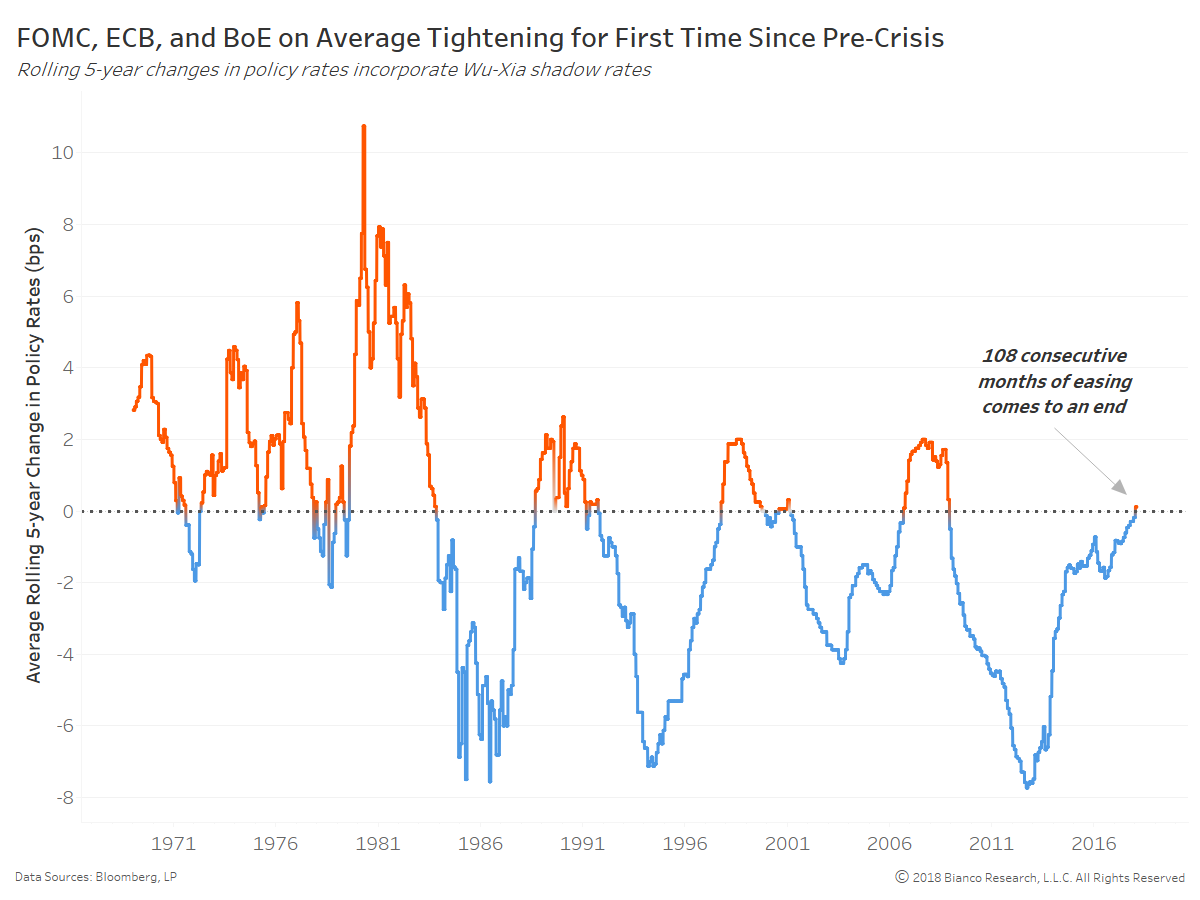
The chart below shows the average rolling five-year change in central bank policy rates by the FOMC, ECB, and BoE. These central banks are now tightening on average for the first time since late 2008, finishing the longest easing cycle on record of 108 consecutive months.
We have used Wu-Xia shadow rates within these calculations in order to incorporate the flow of quantitative easing.
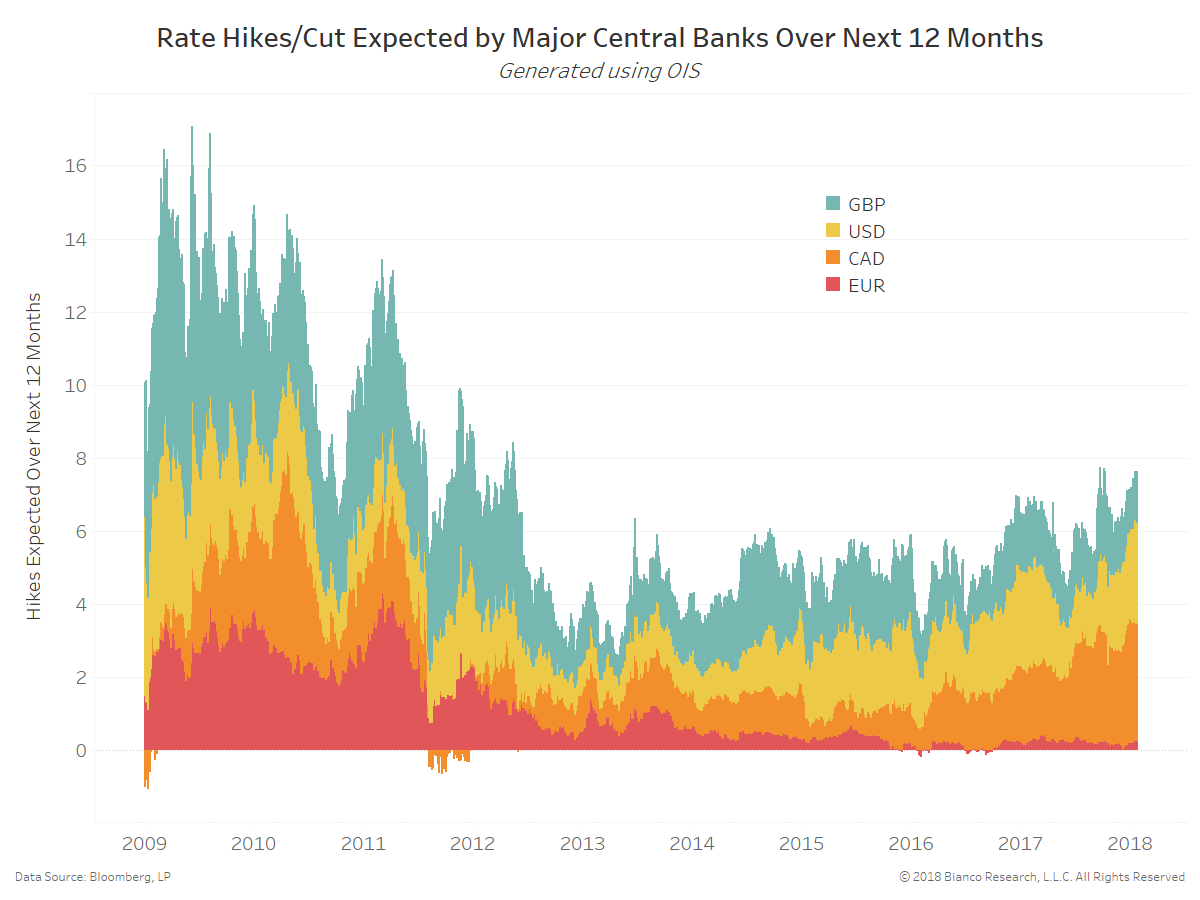
Tightening cycles since the mid-1980s using this metric of five-year rolling central bank actions have peaked near 200 bps. The chart at the top of this post shows markets anticipating nearly eight total hikes over the next 12 months from the FOMC, ECB, and BoE. If we assume hikes of 25 bps, then we would see another 200 bps through the end of the year.
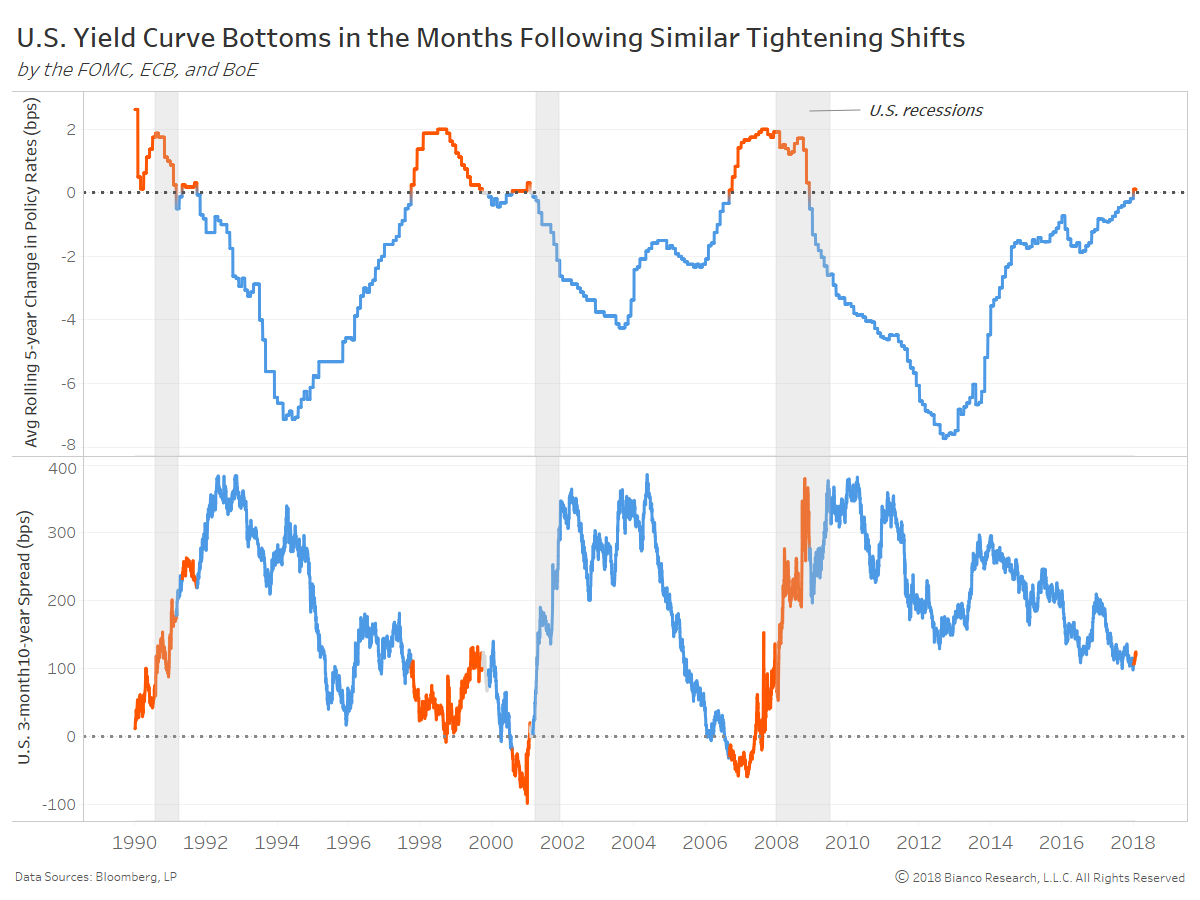
The next chart shows the average five-year change in central bank policy rates in the top panel and the U.S. 3-month 10-year spread in the bottom panel. The red periods of tightening policy on average have been followed by a rebound to a steeper yield curve in the months ahead. Will 2018 be the same?
Also, recessions have typically occurred after each of the past periods of 200+ bps in average tightening. Economies across the globe continue to run hot, therefore this risk remains very low for the time being.