- ValueWalk.com – Finding Dividend Paying Stocks During Market Volatility
In the coming volatile times, it will be more challenging to pick the winners and losers. They will change from one week to the next based on the latest news that has the financial pundits and media a buzz. But that doesn’t mean you can’t add some stability to your portfolio. To do that, you want to focus on strong, dividend paying stocks when the market dips. This strategy will not only give you capital appreciation when those stocks rebound thanks to the low-rate environment we will be in for several years, but, perhaps more importantly, you are locking in a higher yield by buying these stocks on the dips…It’s important to remember that you’re not settling for any old company that occasionally tosses out a pittance of a dividend to shareholders. The trick, however, is to spot companies that have a long history of increasing or maintaining their current dividend payments through tough economic spots. For example, a company that managed to maintain or raise its dividend through the Great Recession (2008 to 2009) is a good indication of strength. If a company was able to pay out a dividend during the Great Recession then it most likely can do it again through present day global turmoil. It’s a testament to their overall financial operations as well as their commitment to returning capital to shareholders in troubling times. That’s why it’s important to find these companies on days when the market insists on acting like a skittish colt. This allows you to take a temporary situation and not only participate in a stock market rebound, but also lock in a significantly higher yield than the company had just a few months ago.
Comment
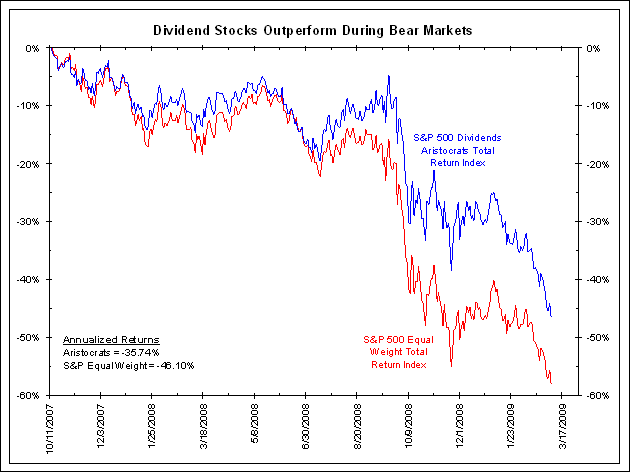
<Click on chart for larger image>
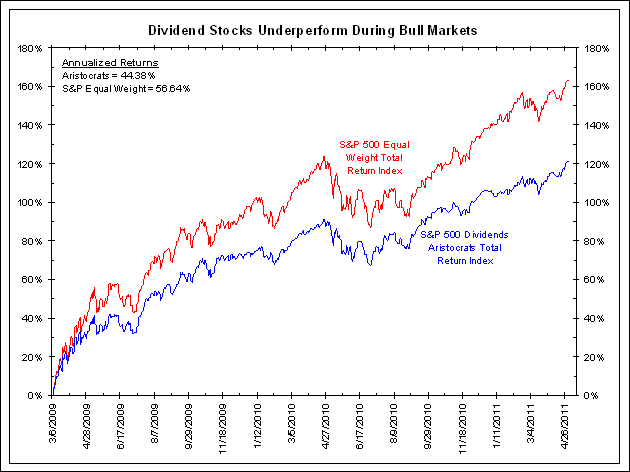
During the bull market from March 6, 2009 to May 2, 2011, dividend-paying stocks underperformed the S&P 500 Equal Weight Index by 42.4%. On an annualized basis, dividend stocks returned 44.38% versus 56.64% for the S&P Equal Weight Index.
<Click on chart for larger image>
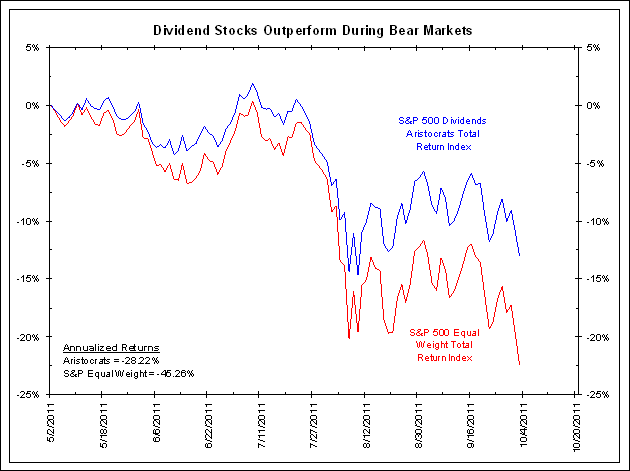
During the bear market from May 2, 2011 through October 3, 2011, dividend-paying stocks outperformed the S&P 500 Equal Weight Index by 9.40%. On an annualized basis, dividend stocks returned -28.22% versus -45.26% for the S&P Equal Weight Index.
<Click on chart for larger image>
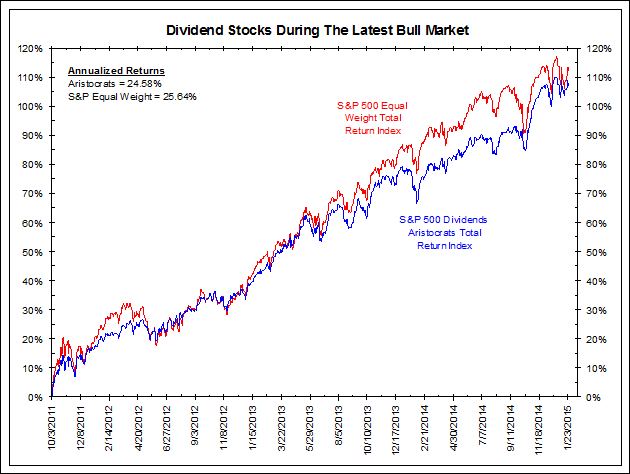
During the latest bull market from October 3, 2011 through January 26, 2015, dividend-paying stocks underperformed the S&P 500 Equal Weight Index by 5.90%. On an annualized basis, dividend payers returned 24.58% versus an annualized return of 25.64% for the S&P 500 Equal Weight Index. Clearly, the markets did not differentiate between dividend payers and non-dividend payers during this period to the same degree as in past periods. A lack of any real volatility throughout this stretch likely contributed to this.
<Click on chart for larger image>
To be sure that these past few bull/bear markets were the rule and not the exception, we also compared total returns of these two indices on all days when the S&P Total Return Index was up versus all days when the S&P Total Return Index was down. With data going back to the beginning of 1990, dividend-paying stocks returned an average of 64 basis points per day on days the stock market was up. The S&P Equal Weight Index returned an average of 76 basis points per day on those same days. On days the stock market was down, dividend-paying stocks returned an average of -65 basis points per day. The S&P Equal Weight Index returned an average of -79 basis points per day.
Rather than being concerned with reaching for yield, the charts and data above suggest dividend stocks outperform during bear markets and underperform during bull markets. However, if investors are savvy enough to know which way the market was heading in general, why even bother distinguishing between dividend-paying stocks and non-dividend-paying stocks?


