Concerted Global Growth is Over, Now What?!

Client Conference Calls — April 25, 2018

Markets

We are not getting excited about U.S. 10-year yields hitting 3.0%. Slowing economic growth will likely keep sovereign yields from racing higher, even if inflation begins to percolate. Concerted global economic growth has ended with data changes detaching and the percentage of economies producing above-average growth nearing a drop below 60%. Defensive sectors and municipal bonds top our list of attractive investments.


Summary

We are not getting excited about U.S. 10-year yields hitting 3.0%. Slowing economic growth will likely keep sovereign yields from racing higher, even if inflation begins to percolate. Concerted global economic growth has ended with data changes detaching and the percentage of economies producing above-average growth nearing a drop below 60%. Defensive sectors and municipal bonds top our list of attractive investments.

Comment

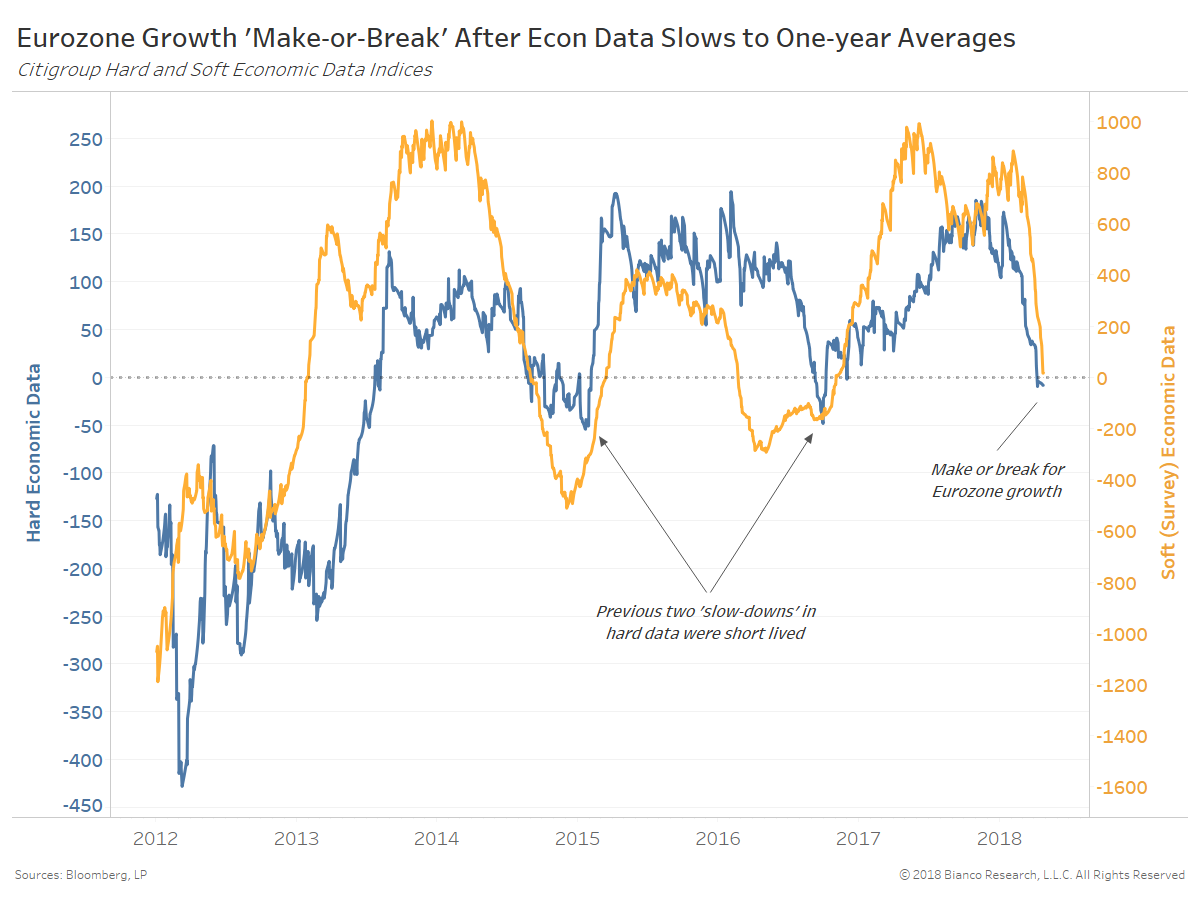
The Eurozone’s hard (official) and soft (survey) economic data have slowed after solid growth throughout 2017. The chart below shows Citigroup hard (blue) and soft (orange) economic data change indices retreating to one-year average growth rates (i.e. zero).

The Eurozone economy has proven resilient following previous soft patches beginning late summer in both 2014 and 2016. But, Draghi’s hope for rising inflation on the heels of concerted economic growth is again on shaky ground. 


On the flip side, the U.S. remains the odd man out by maintaining well-above average hard (brown) and soft (blue) economic data growth. U.S. 10-year yields have accordingly risen to range wides relative to other developed economies. The U.S. / German 10-year spread hit its widest at 237 bps since 1989.


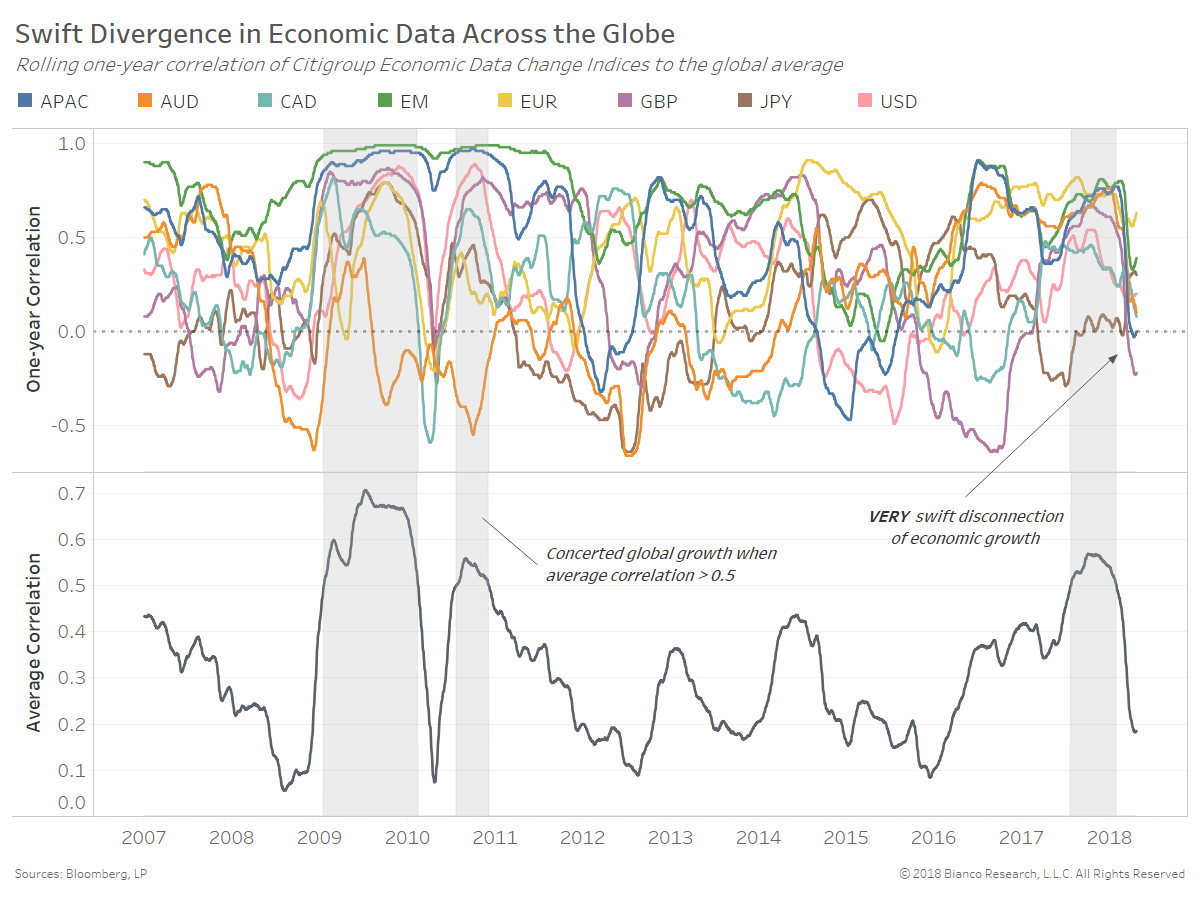
The period of ‘concerted global growth’ has ended with economies having diverged in Q1 2018. The chart below shows the rolling one-year correlation of each economy’s data changes to the global average. We have shaded periods when the average correlation pushed above 0.5, indicating a coordinated global economic event.

The average correlation of economic data changes dropped from 0.57 in October 2017 to a paltry 0.18 in April 2018.


The next chart is a favorite of ours showing the percentage of economies producing data surprises (yellow) and above-average realized data growth (green). Only 33% of economies are producing data beats. The percentage of economies producing above-average data changes has dropped from a peak of 92% in August 2017 to 61% as of today (April 24). 


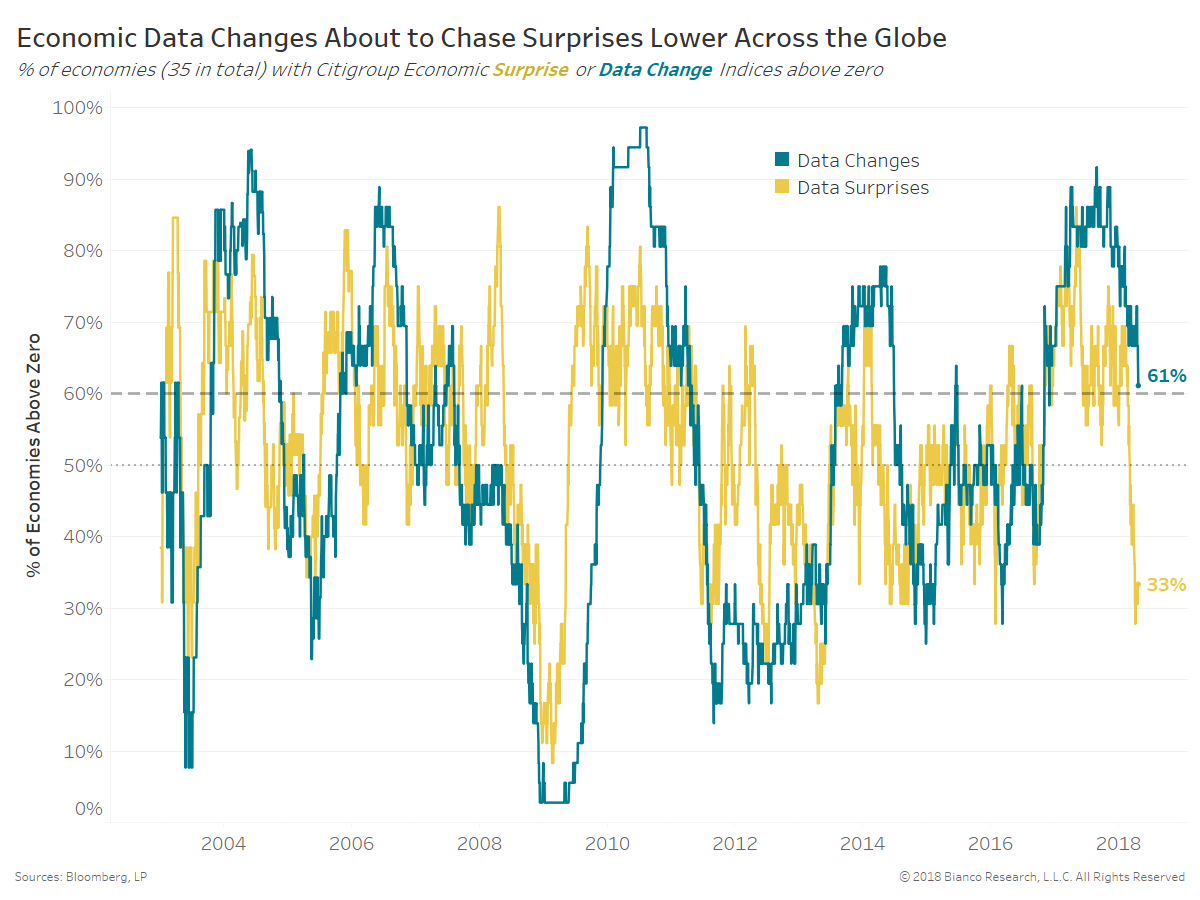
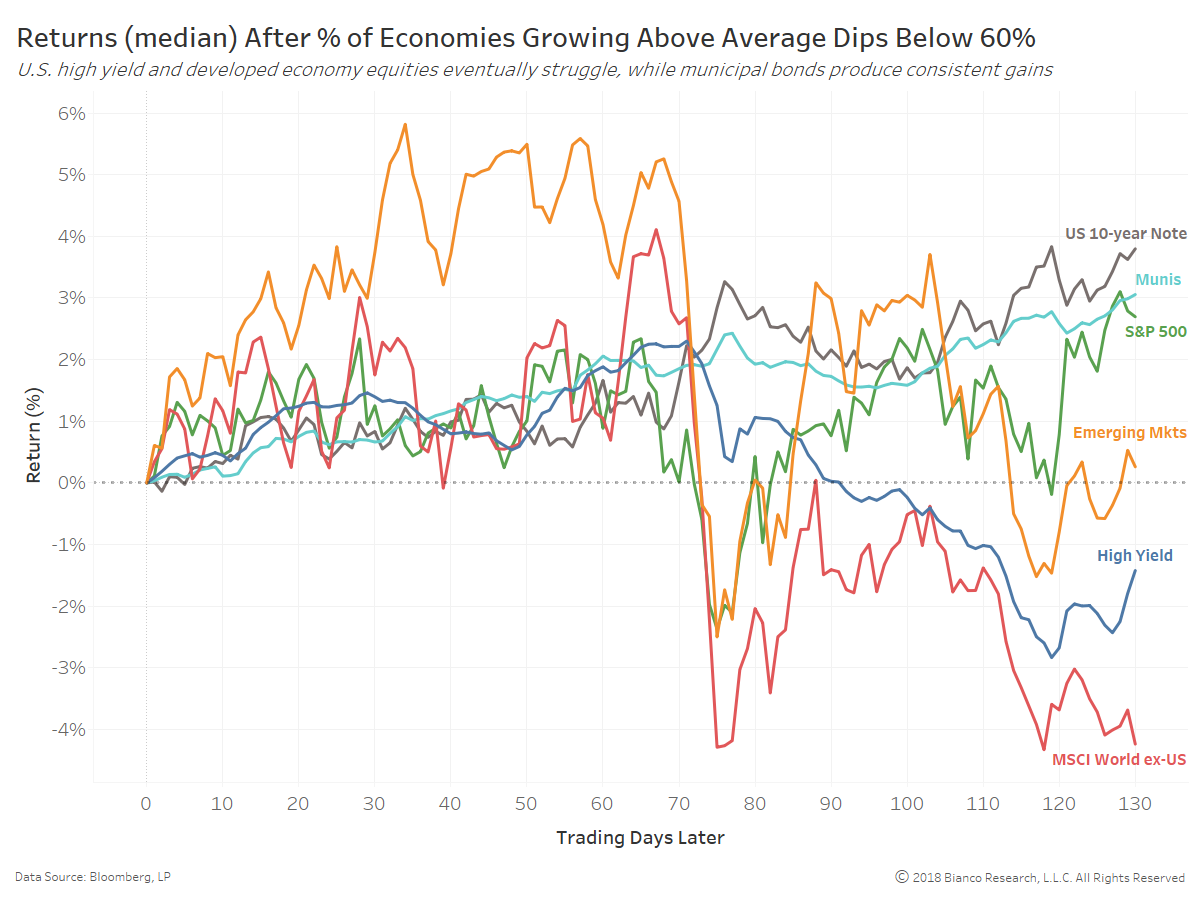
Drops below 60% of economies producing above-average data changes have marked jumps in volatility and trouble for risk assets. The chart below shows the aftermath of these past events for major asset classes. 

All but emerging market equities (gold) produced tepid returns over the following quarter (first 63 days below). However emerging markets, developed equities ex-US (red) and U.S. high yield (blue) all quickly ran into trouble the following quarter (through day 130).