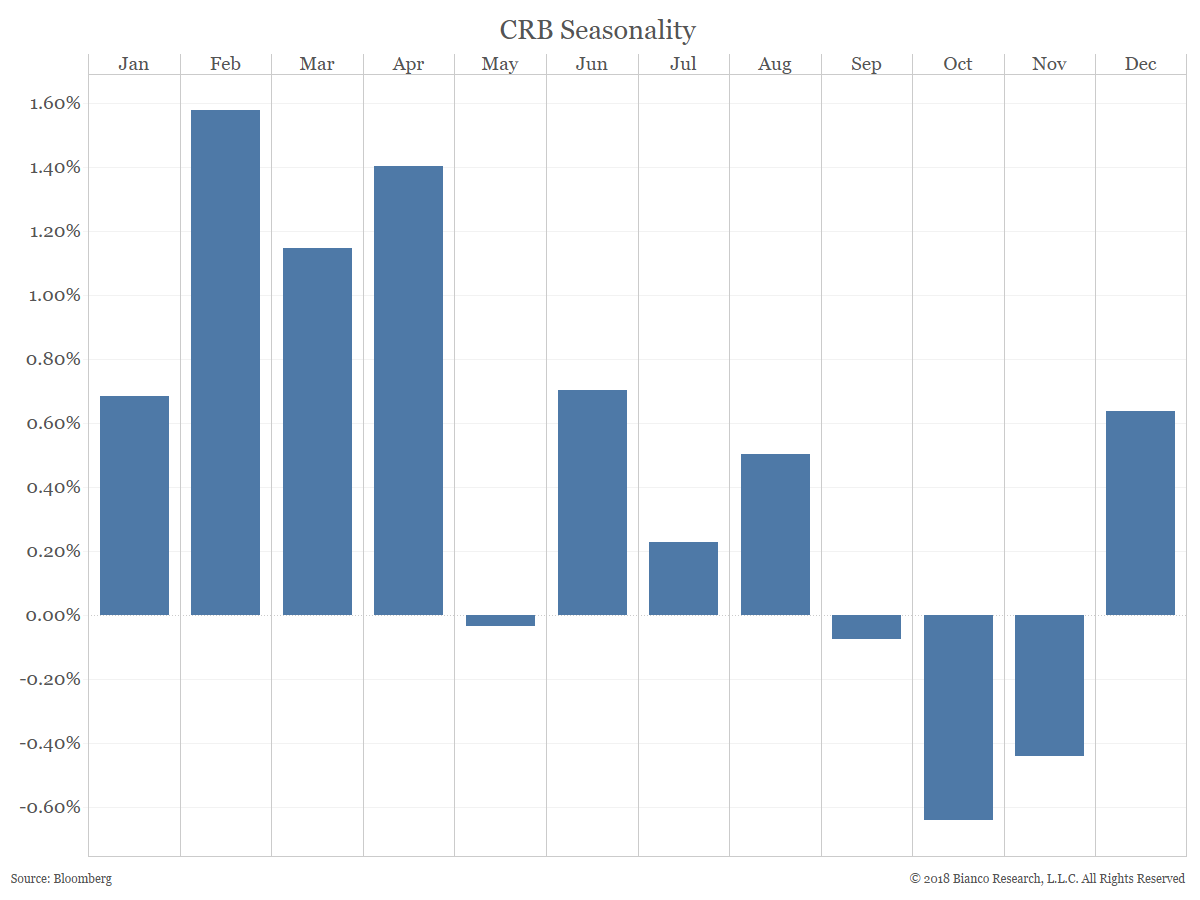
Commodity returns are entering a terrible time of the year on a seasonal basis. The stretch from September through November rank as the three worst months for the CRB since the beginning of 1980.
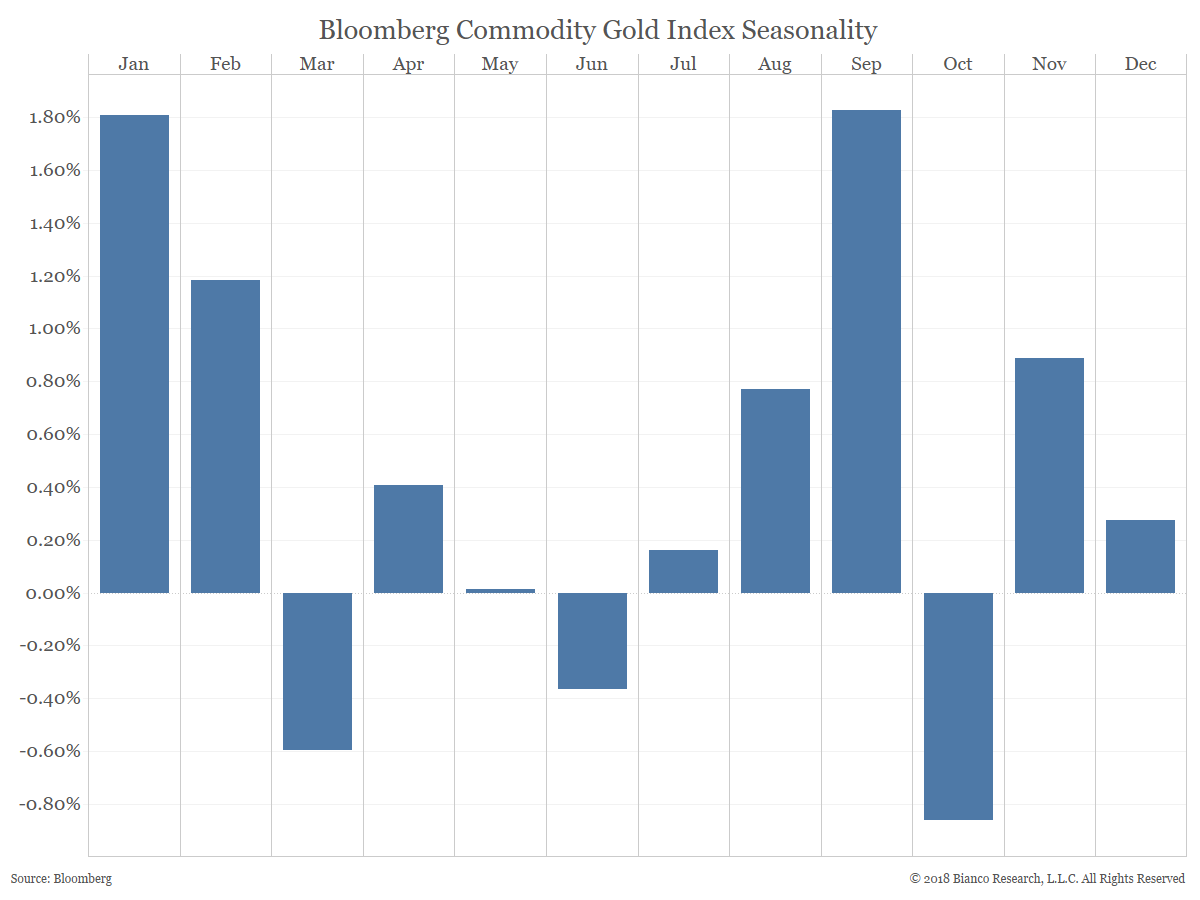
Gold, which makes up 6% of the CRB Index, bucks the trend of poor commodity performance in September.
The interactive visualization below offers a similar breakdown of many different assets. Those interested can choose different timelines, assets, or even which measure is shown (average, median, standard deviation).
While seasonality is not meant to be used as a trading tool, it can highlight long-held historical trends that may add further support or oppose already-formed views.
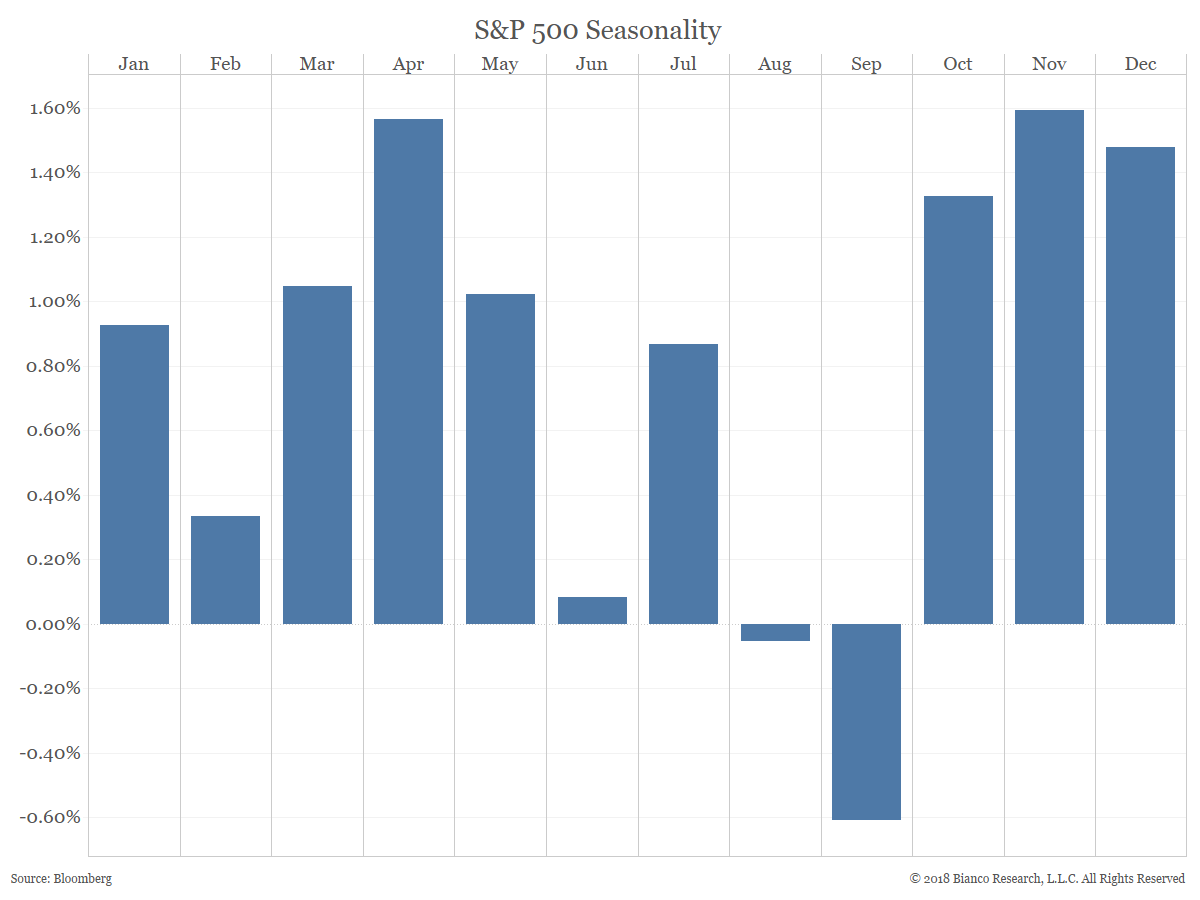
We have always warned against placing too much emphasis on seasonal adages such as “Sell in May and go away.” The problem is the sample size of monthly returns is small enough that the data can be twisted to support just about any opinion. However, the month of September tends to be a quirky month for many assets on a seasonal basis and is worth examination.
The chart below shows each month’s average return for the S&P 500 since the beginning of 1980. While September is historically the worst month to own stocks over this period, note that the stretch from October through December offers three of the best four months of the year to own stocks.