Summary
Comment
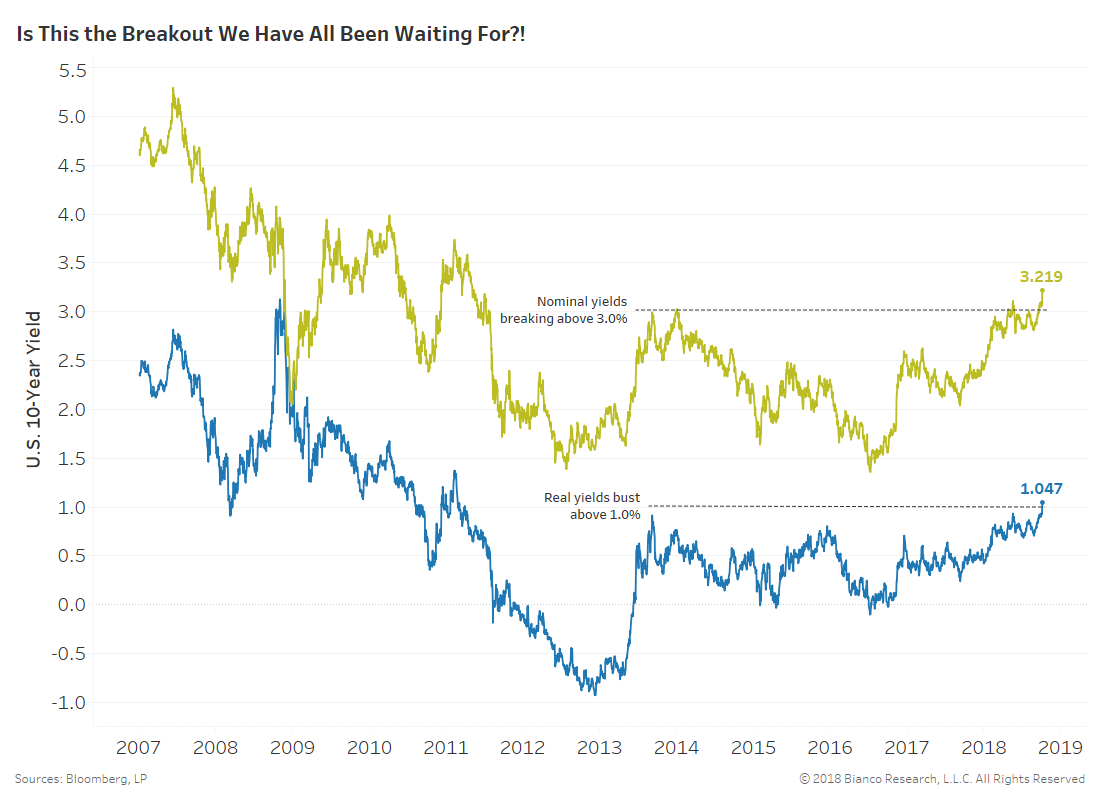
Long-end U.S. Treasuries are breaking free of trading range highs in place since 2013. We can partially thank stronger economic data coupled with Powell’s ‘not too good to be true’ economic assessment. German and U.K. yields are following suit today with their 10-year sovereigns higher by 7 to 8 bps.
We are most excited by a break above 1.0% by U.S. 10-year real yields (TIPS). But, a continued breakout requires inflation expectations to finally join the party and leave their well-anchored condition.
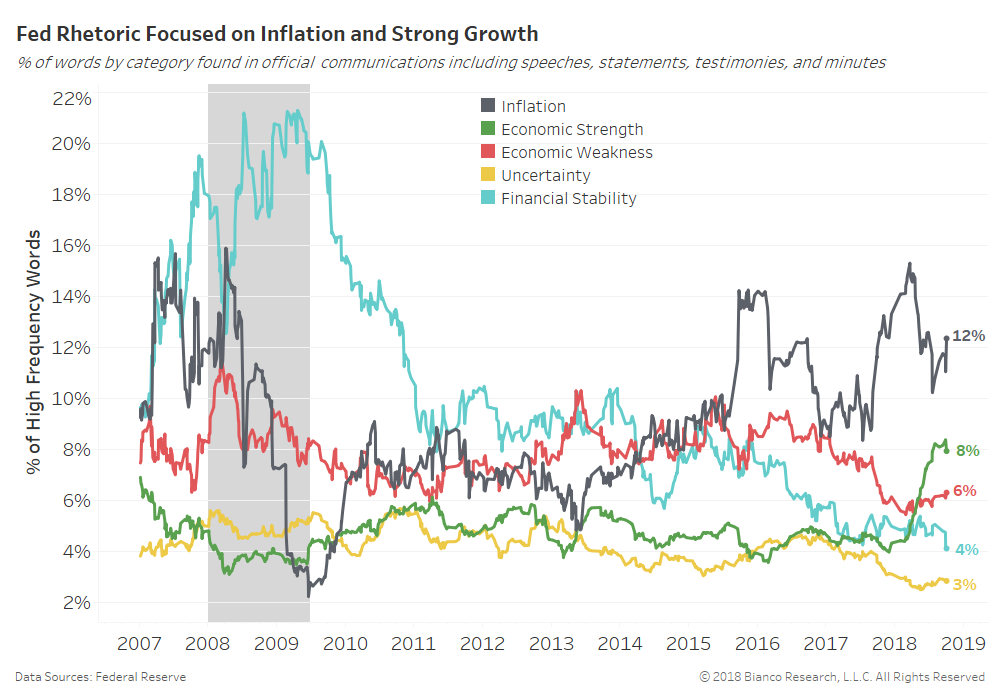
The chart below shows the percentage of Federal Reserve rhetoric allocated to each topic from inflation to financial stability. We use a rolling 25-speech/statement sum divided by the use of the highest frequency words found in our lexicon.
Inflation remains the topic of choice, while uncertainty and financial stability fall off the map. Most notably, Fed officials have uttered words of economic strength (green) at their greatest rate post-crisis, exceeding words of weakness (red) for the first time in early May 2018.
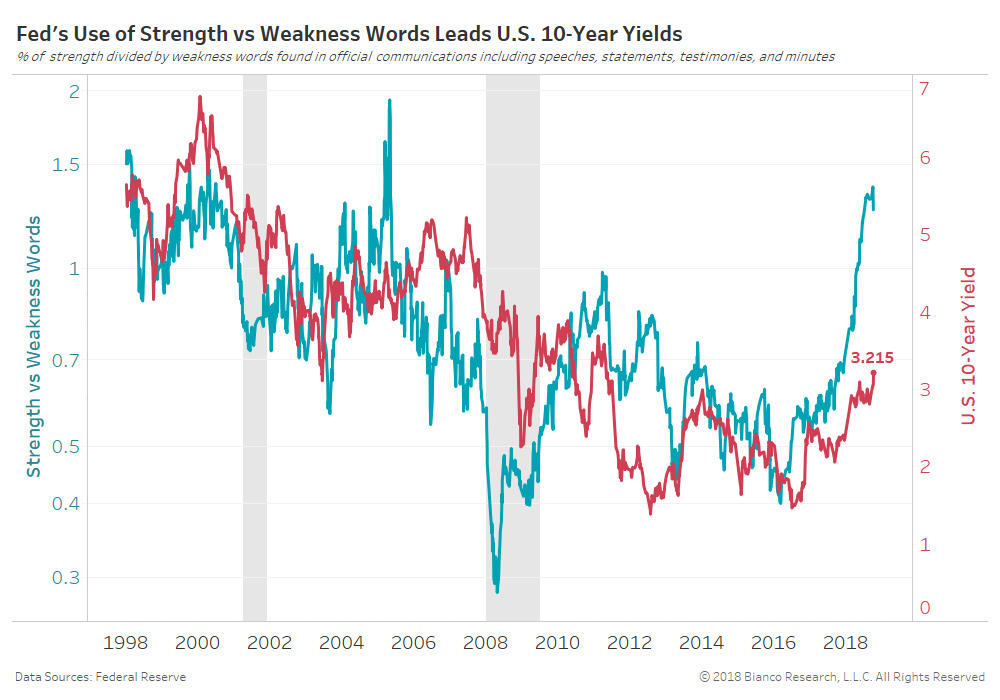
The next chart shows the ratio between the share of strength and weakness words in Fed communications (blue, left axis) along with the U.S. 10-year note yield (red, right axis).
The ratio has emphatically turned to strength not heard since May 2005. The doves, centrists, and hawks are all offering very upbeat comments on U.S. consumers and businesses.
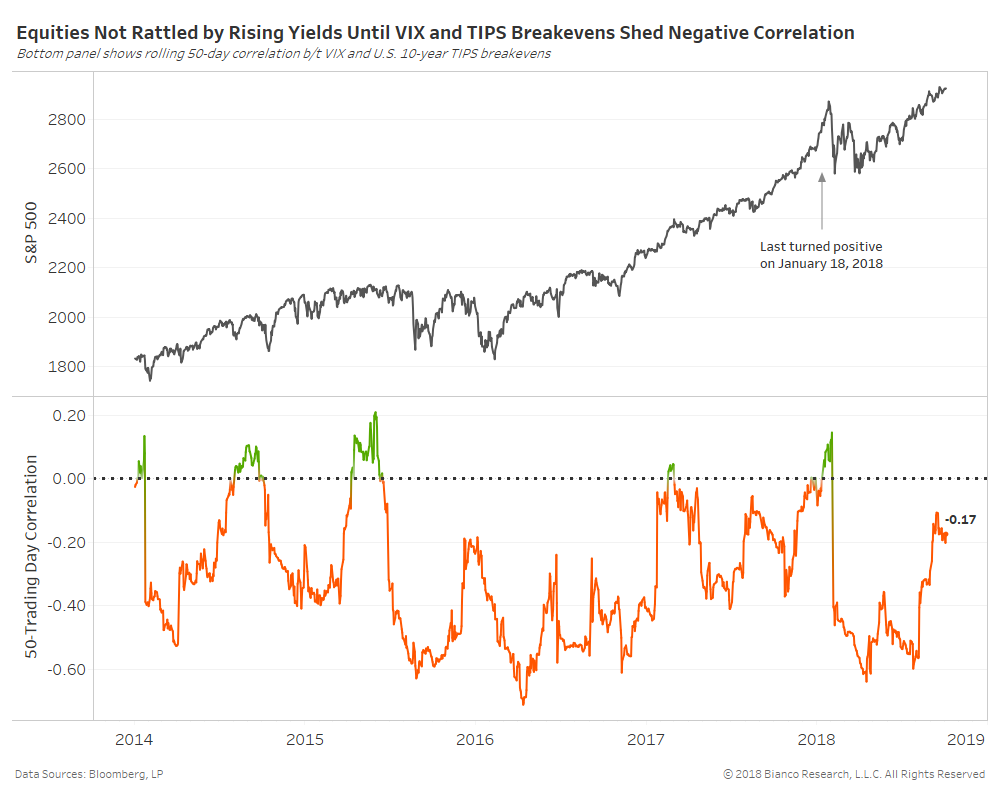
U.S. equities have thus far been unfazed by higher long-end yields. We continually watch the 50-day correlation between the VIX and U.S. 10-year TIPS breakevens (inflation expectations) to telegraph actual concern about inflation and higher yields.
This correlation or fear gauge is still modestly negative. The last turn to positive correlation preceded the S&P 500’s drawdown of 10% in February 2018.
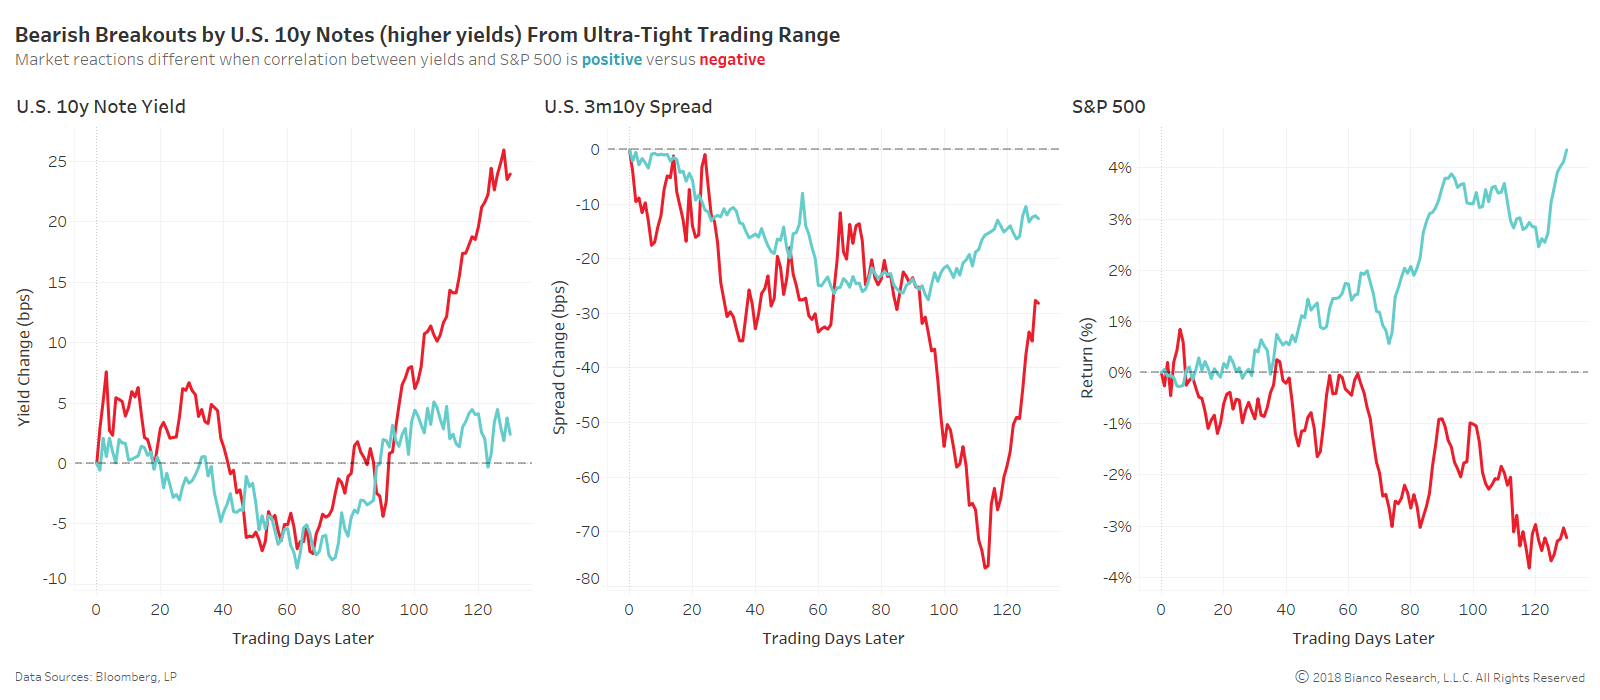
How investors view inflation and yields as supportive or not for the economy has a substantial impact on the aftermath of bearish breakouts by U.S. 10-year yields.
The chart below separates all upside breakouts by U.S. 10-year yields from tight trading ranges below 60 bps by positive (blue) or negative (red) correlation between the S&P 500 and U.S. 10-year yields. The average moves shown below use data since 1965 in order to include numerous types of economic and inflation cycles.
U.S 10-year yields have fallen back into trading ranges over the ensuing three months, but ultimately continue higher when yields and equities were negatively correlated. The S&P 500 has consistently rallied when yields and equities were positively correlated like today.
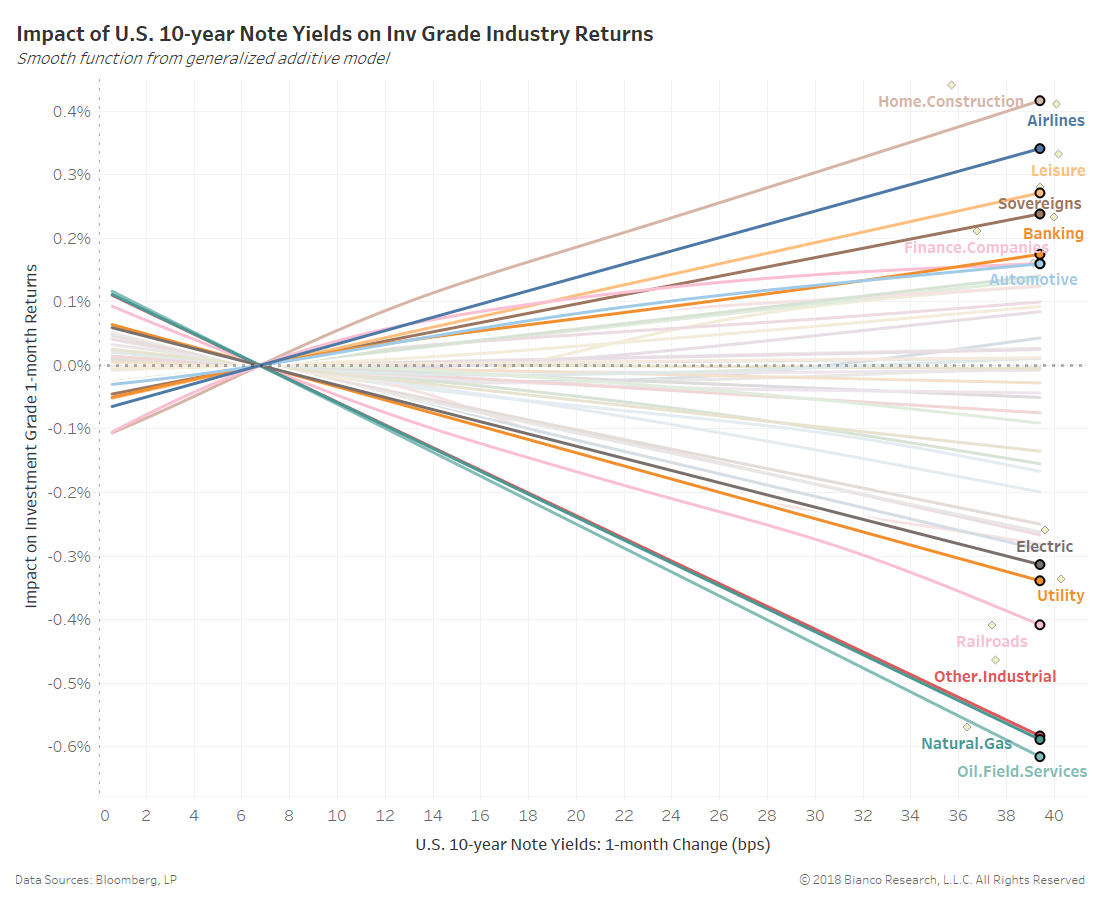
The chart below shows the relationship between changes in U.S. 10-year yields (x-axis) and investment grade corporate bond returns by industry (y-axis).
The impact of higher U.S. 10-year yields is quite negative for a slew of investment grade industries including oil & field services, natural gas, utilities, and rail roads. However, home construction, airlines, leisure, banking, and automotive have been positively impacted.
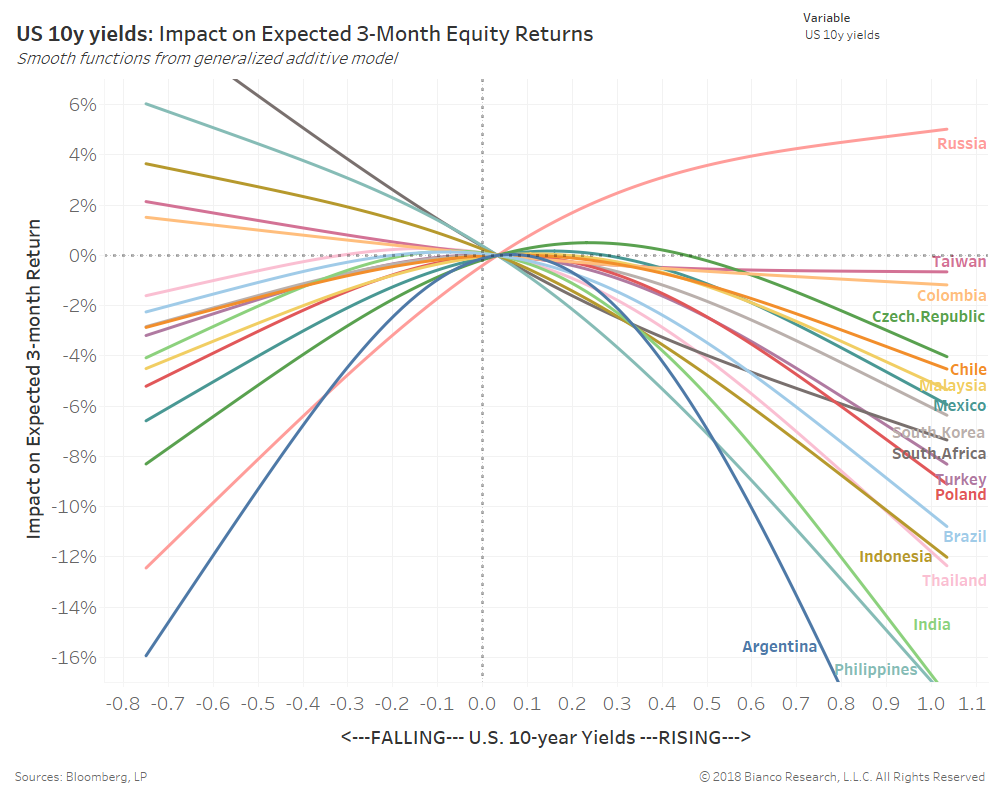
Not all emerging markets suffer due to higher U.S. 10-year yields. The last chart shows the relationship between three-month changes in U.S 10-year yields (x-axis) and emerging market equity returns (y-axis).
Argentina, Philippines, India, and Indonesia have historically struggled during higher yields. Russia, Taiwan, Columbia, and Czech Republic have had positive to modest impact.