- The Wall Street Journal – A Warning Sign Behind the Market Swings
The economy is still abnormally dependent on low interest rates and richly priced assets
Don’t worry about stock-market volatility: It is perfectly normal. Do worry about how stocks got so high to start with because it is evidence of an economy still abnormally dependent on low interest rates and richly priced assets. The 2,271-point drop in the Dow Jones Industrial Average in the week through Monday, a decline of 9%, didn’t even meet the usual 10% threshold for a correction. Tuesday’s 567-point rebound didn’t make the top-500 daily increases by percentage. Wednesday’s 509-point swing between high and low was positively humdrum, with the Dow closing down 19 points, or 0.1%, at 24893.35. Even more reassuring, the volatility is being driven by the most banal of reasons: worries about inflation and interest rates. - The Wall Street Journal – Stocks Changed, But Bonds Still Sound the Same
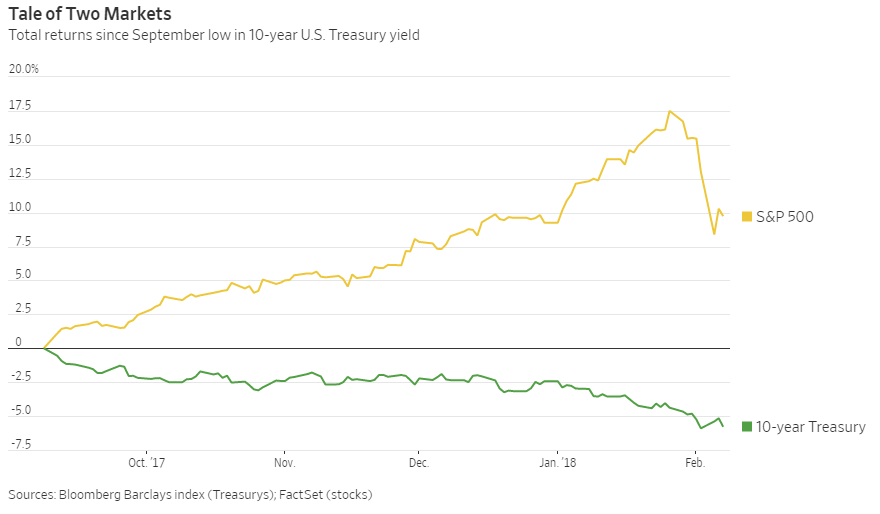
Why trouble for stocks won’t be a boon for bonds this time
Those are exactly the forces—combined with technical concerns about greater supply of bonds as the U.S. expands its budget deficit, and central banks cut back on stimulus—that have driven bond yields higher and favored stocks in the past year. Unless the economic outlook deteriorates, or central banks show signs of concern about market moves and hint at softening their stance, there seems to be little reason for bonds to rally. Selloffs in the past few years in the bond market have been characterized as “tantrums,” and the lack of inflationary pressures has meant they have reversed. But this time the move is more fundamentally driven, and thus has more staying power. That is the mark of a dip that shouldn’t be bought.
Summary
Comment
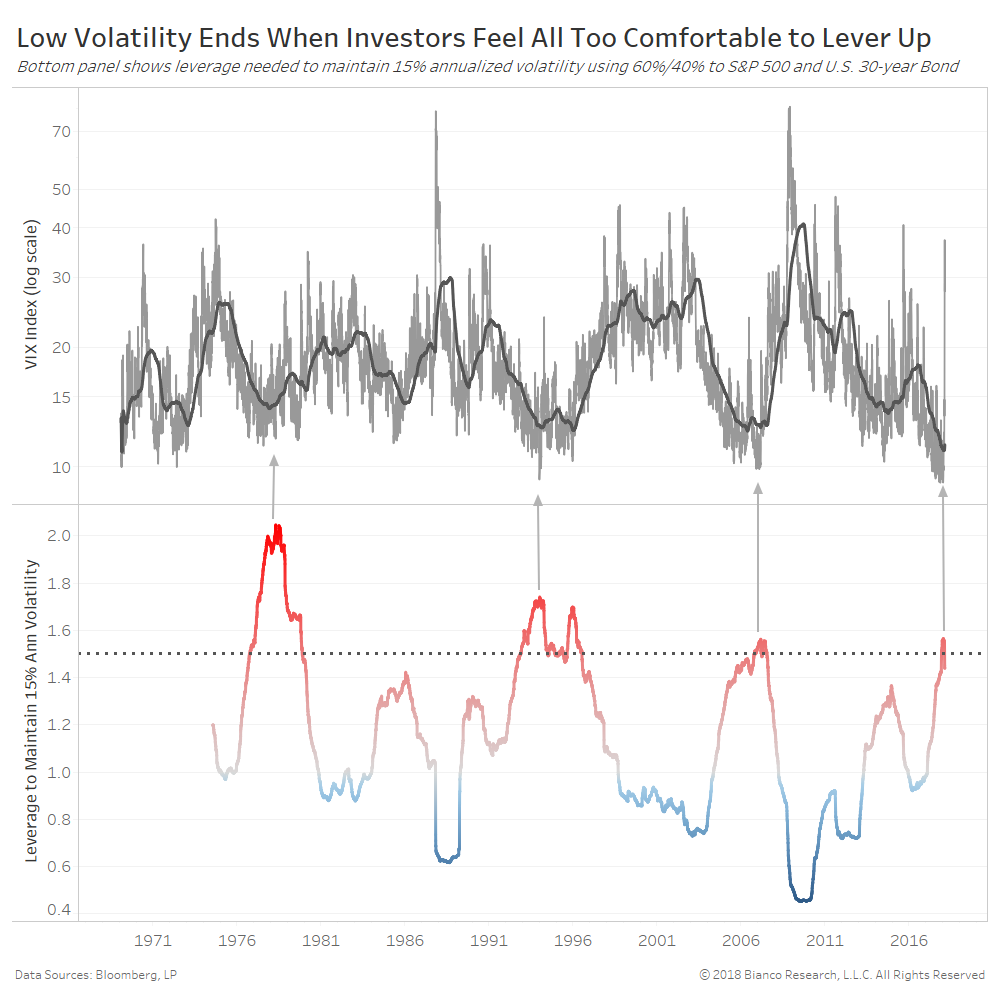
The chart below shows the VIX (log scale) in the top panel and the multiple or leverage needed to maintain 15% annualized volatility for a portfolio of 60% equities and 40% U.S. Treasuries. The average annualized volatility since 1970 of a 60/40 portfolio is 15%.
Historically, regime shifts to rising volatility occur when this leverage ratio exceeds 1.5, which just occurred in mid-December 2017. Extreme comfortability of investors in a low volatility, inflation environment cannot last forever. Based on this metric, investors will change their behavior in anticipation of heightening risks.
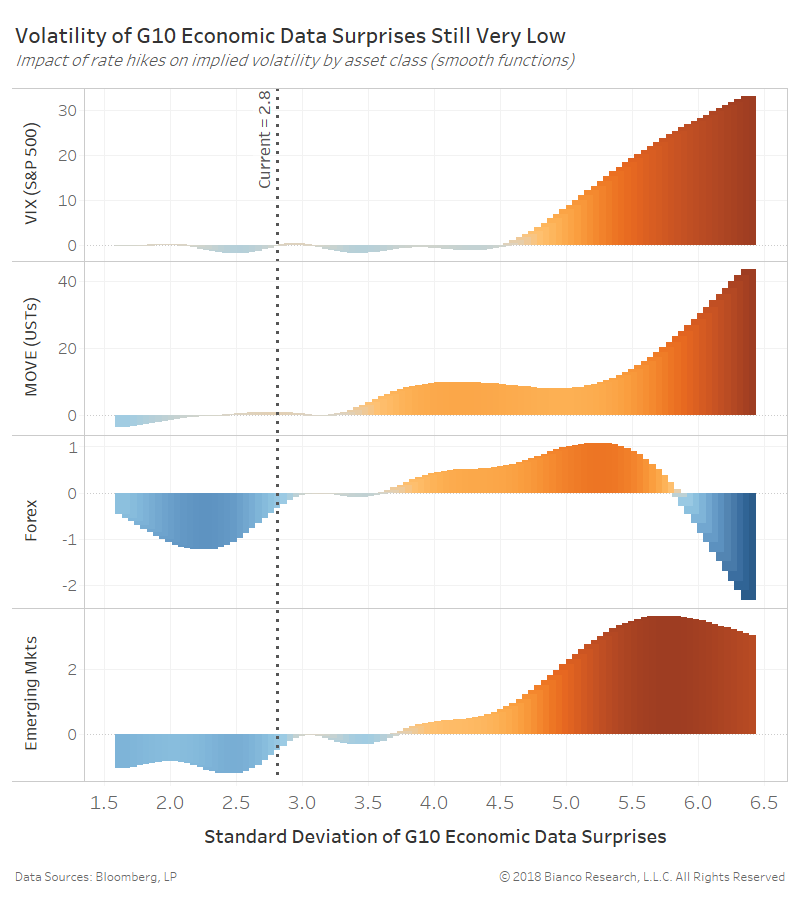
We can explain implied volatility across major asset classes using the following:
- Economic Data Changes – G10 and Emerging Markets
- Economic Data Surprises – G10 and Emerging Markets
- Inflation Expectations – Inflation breakevens across major economies
- Pace of Rate Hikes – 12-month expectations for the Fed, ECB, and BoE
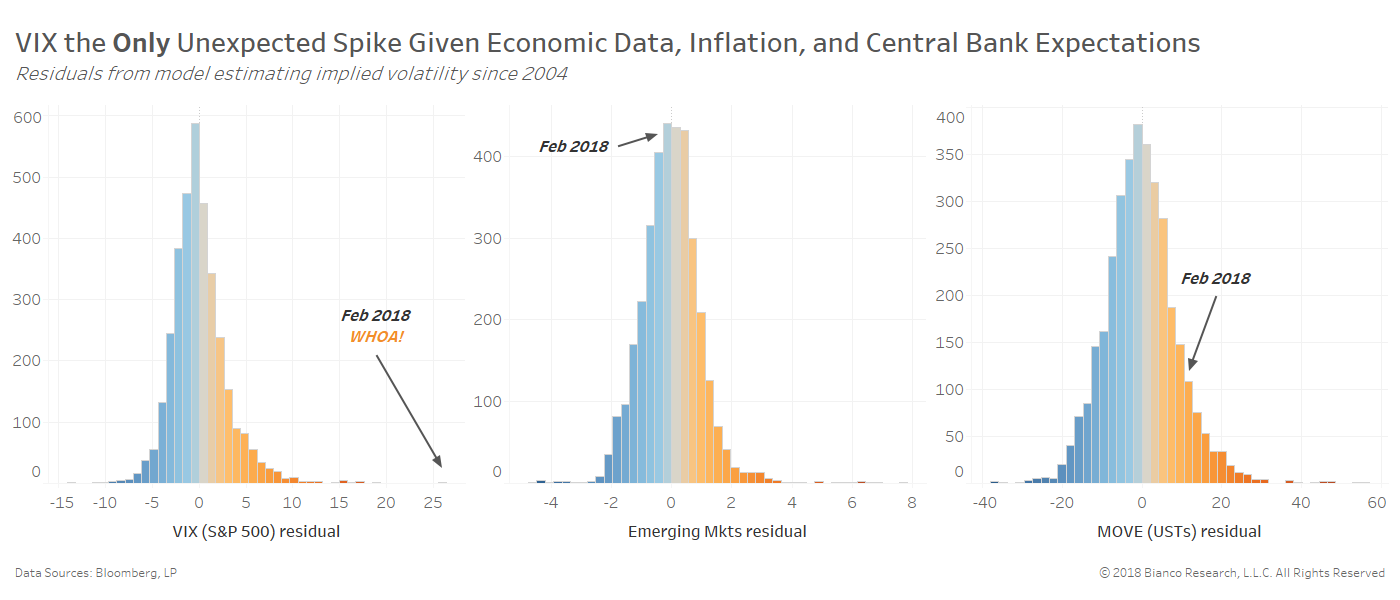
These variables are capable of explaining 80+% (r^2) of the variation in implied volatility of the S&P 500, DAX, U.S. Treasuries, foreign exchange, gold, and emerging markets.
The chart below shows estimates (blue line) for the VIX along with model residuals (actual – estimate) in the bottom panel. The dramatic equity selloff in February 2018 produced the largest deviation from estimates in history back to 2004. These estimates will not pick up on unexpected events like geopolitical risks, but do efficiently match volatility induced by economic growth, inflation, and rate hike timing.
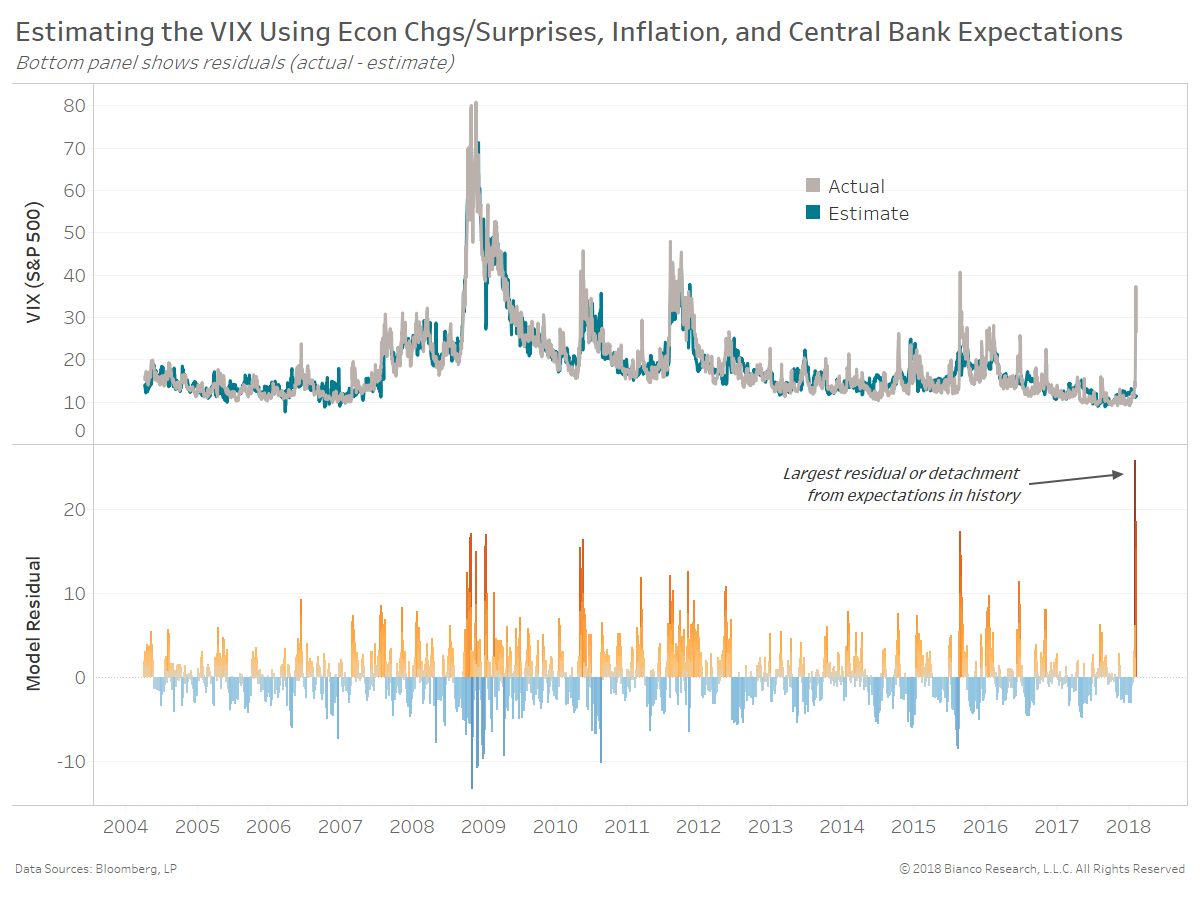
But, do not place the blame of increased volatility on the fall-out from VIX-related ETFs. Rising volatility across asset classes will be normal given rising inflation and tightening expectations.
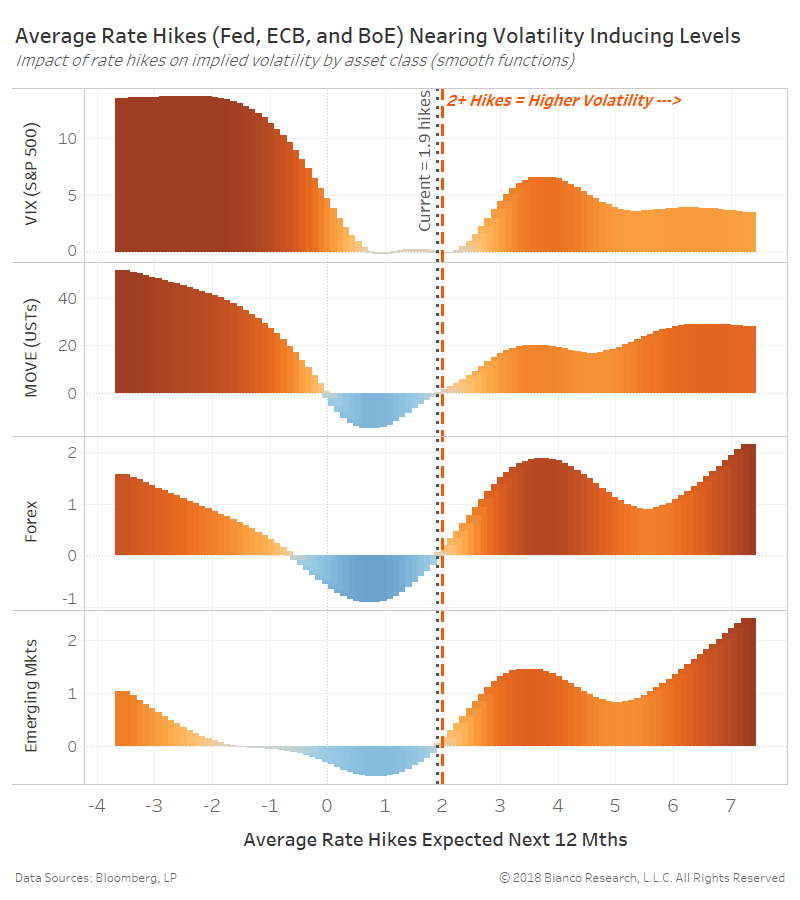
The next set of charts show the impact of the average number of rate hikes expected by the Fed, ECB, and BoE on each asset class’s implied volatility. Currently, an average of 1.9 hikes are expected and will likely grow given Carney’s comments this morning for raising rates “somewhat sooner, and to a somewhat greater extent.” Markets were only pricing in a total of 1.4 hikes in the 12-months ahead by the BoE, therefore there is plenty of catching up to Carney’s three hikes in 2018.
Volatility appreciably rises (red bars) across all asset classes when the Fed, ECB, and BoE show an average pace of hikes above 2.0 (see the dotted red line). Simply expecting an average of 3.0 hikes would increase the VIX by 5.0 and MOVE by nearly 20.
Markets will view an acceleration of rate hike timing as the beginning of a major battle against impending inflation. The more inflation expectations rise, the more parties (i.e. asset classes) are thrust into this war.