Comment
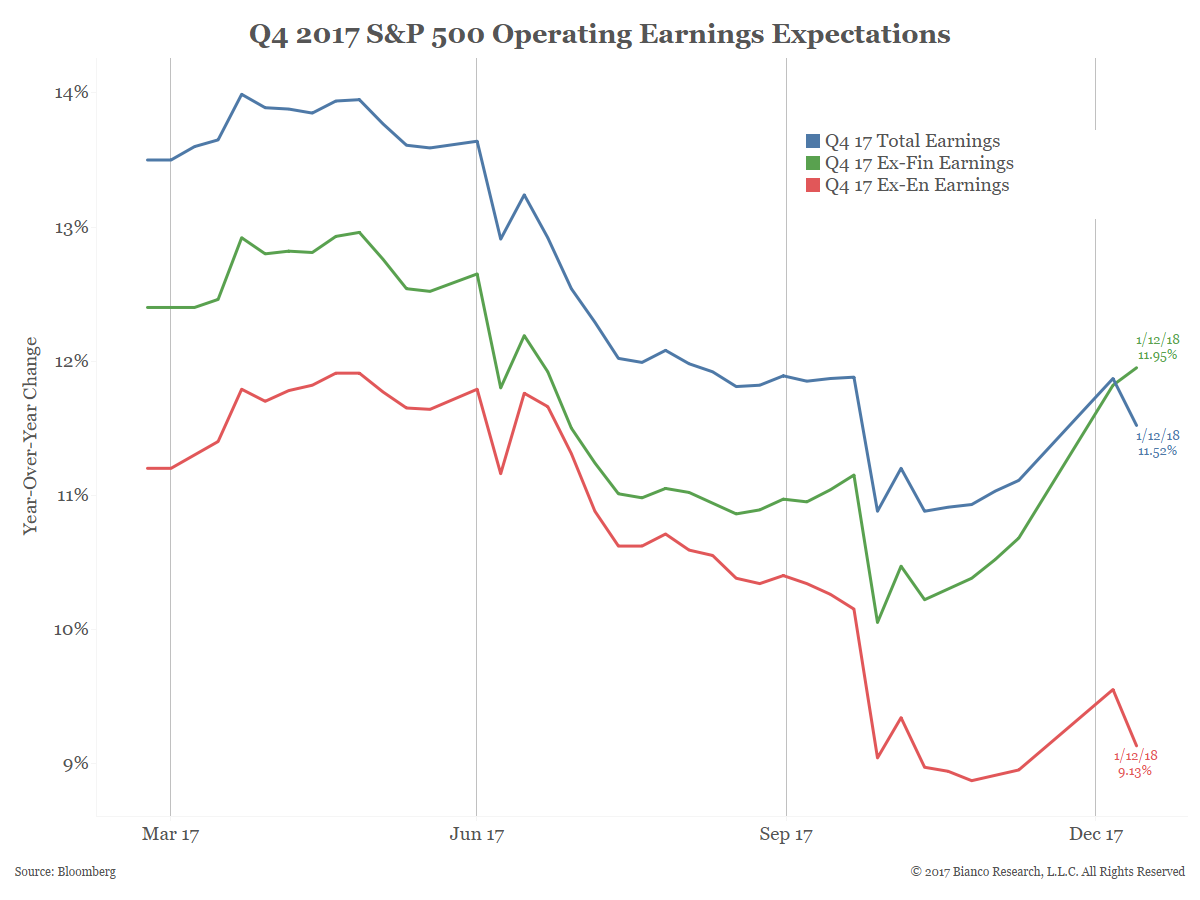
The next chart shows Q4 2017 year-over-year operating earnings estimates. It is a blended chart which starts with 500 bottom-up estimates. Once earnings season starts (gray vertical lines) the estimates are replaced with actual results.
Analysts expect 11.5% growth (blue line). The fact that estimates rose as earnings season approached is very unusual.
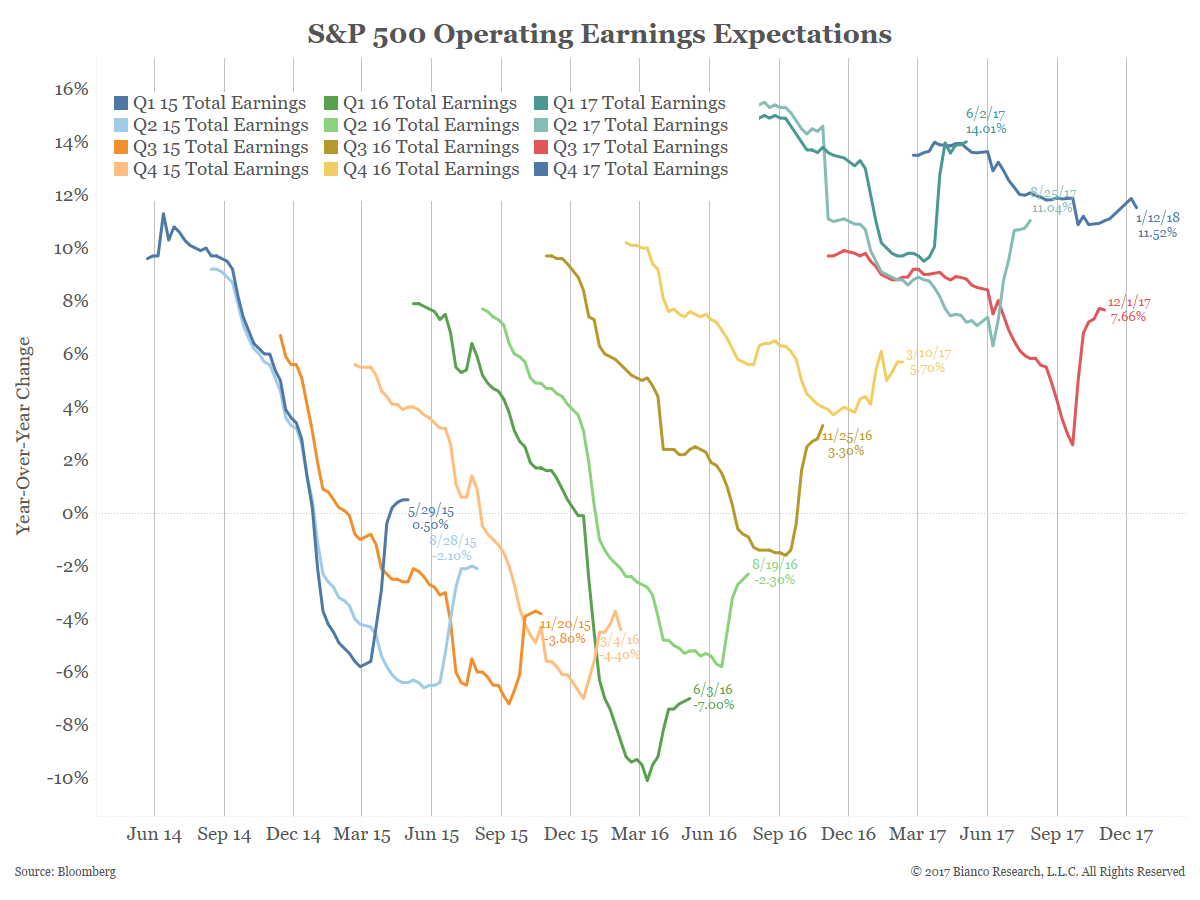
As the chart below shows, estimates typically fall until earnings season starts (vertical gray lines) and then bounce higher.
However, see the blue line on the right side of the chart below. Q4 2017 earnings estimates were actually rising before earnings season even began.
Expectations are so strong for Q4 that analysts have broken from their usual pattern of lowering estimates prior to earnings releases. Will this optimism be realized? We will find out as companies begin reporting.
Last week (webcast, conference call) we noted that Q4 earnings expectations are very high. Through Friday only 26 of the S&P companies have reported, so it is still early days in the earnings season.
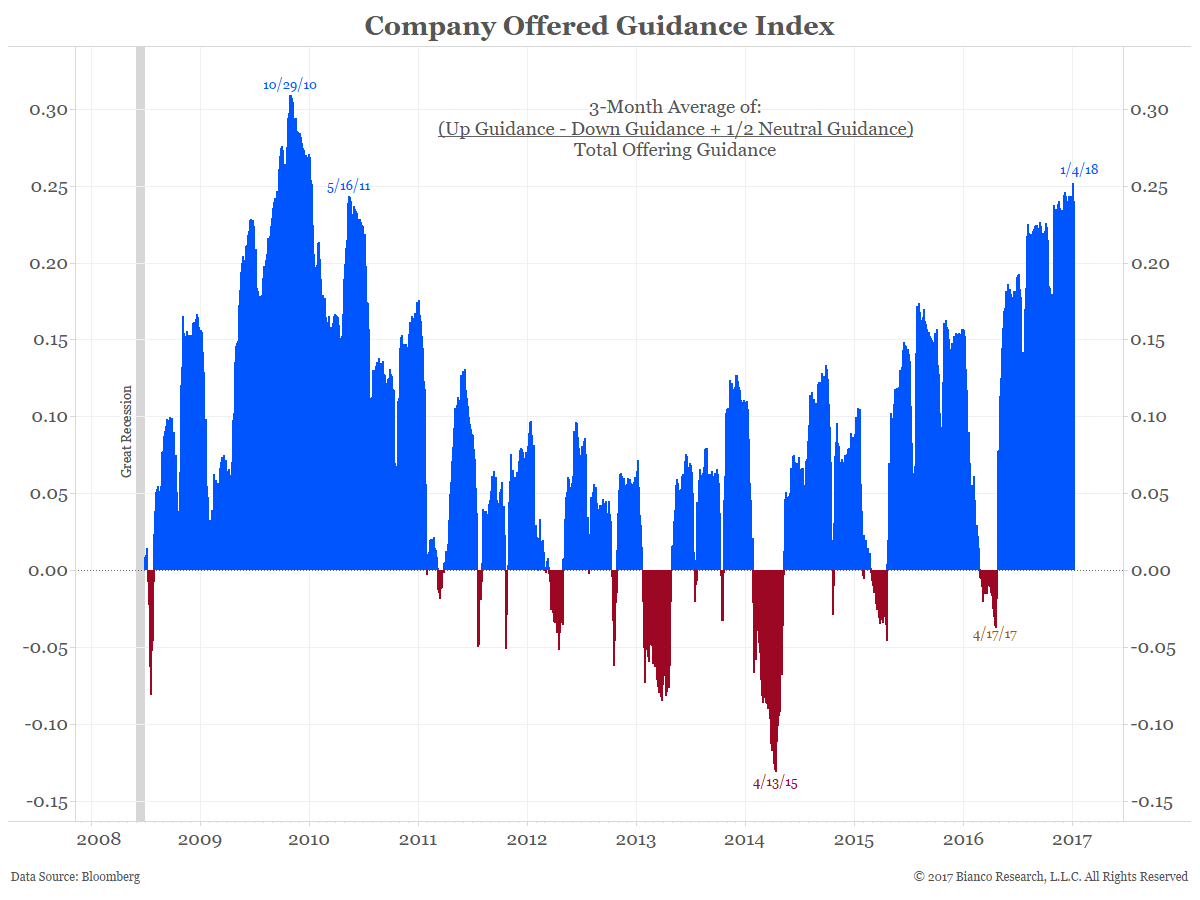
The chart below shows an index of earnings guidance offered by companies. Its construction is noted on the chart. This measure is showing the most optimism since 2010.