- Bloomberg – Goldman, Barclays See ‘As Good As it Gets’ 4% Global Growth
Most bullish economists predict fastest expansion since 2011
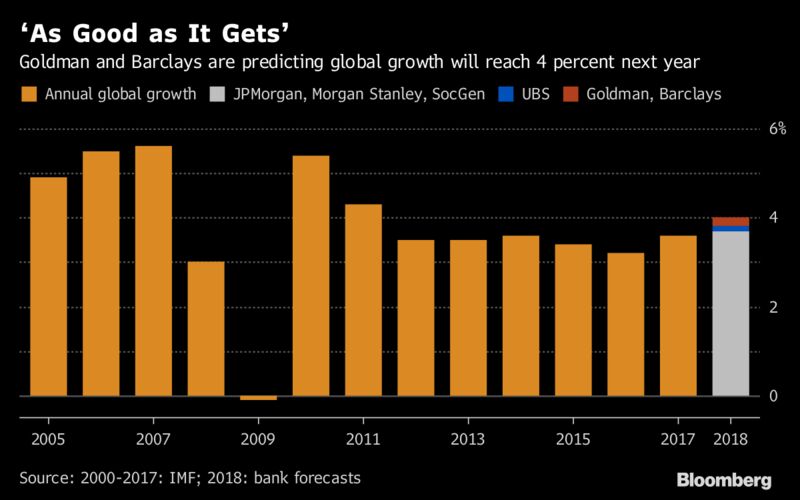
It’s looking like boom time in the world economy again. As more economists publish their 2018 outlooks, those from Goldman Sachs Group Inc. and Barclays Plc are proving the most bullish in predicting global growth will reach 4 percent next year. That would be the strongest since 2011 and up from the 3.7 percent that Goldman Sachs estimates for this year. “The ongoing economic expansion has substantial momentum,’’ Barclays economists Ajay Rajadhyaksha and Michael Gavin wrote in a Nov. 16 report. “It is not overly reliant on any single geographical region, industry, or source of demand. It does not seem to have generated economic or financial excesses that pose an immediate threat.’’ - Bloomberg – OECD Warns Markets Too Optimistic as Global Economy Peaks
Asset prices ‘inconsistent’ with expectations for growth
The OECD cautioned investors that asset prices have gotten too high for a global economy that is set to peak next year and a market downturn could put the expansion at risk. World output will probably grow 3.7 percent in 2018, the best in years, before slowing to 3.6 percent in 2019, the Organization for Economic Cooperation and Development said Tuesday in a semi-annual report. The U.S. economy is set to reach its peak next year, while the euro area, Japan and China will likely slow in both 2018 and 2019, according to the report.
Summary
Comment
Economists are increasingly providing differing outlooks for growth in 2018 just like the two opposing articles shown above.
The chart below shows z-scores for economists’ forecast ranges (maximum minus minimum) of major U.S. economic and market measures. Higher values indicate large ranges, hence greater uncertainty.
Forecasts are increasingly widening for consumer spending (orange), non-farm payrolls (yellow), and overall real GDP (light blue). Conversely, forecasts remain very tight for inflation measures like PCE (purple) and U.S. 10-year note yields. These forecasts are at odds with each other.

The bond market’s indication of uncertainty is found in implied volatility (MOVE index) and the term premium. The next chart shows the 90-day change in U.S. 10-year term premium (blue) and economists’ average forecast range across major economic measures (orange). Term premium typically rises with widening forecast ranges, reflecting greater uncertainties.
However, term premium has yet to rebound, just like economists’ forecasts ranges for inflation and interest rates.

The chart below shows the z-score for the rolling count of news stories concerning each policy initiative by the U.S. government along with words of ‘uncertainty.’
Policy uncertainty measures have bounced in recent weeks, predominately due to tax plan legislation (blue).


Lastly, we have been assessing an alternative market-based measure capable of better capturing economic policy uncertainty. Equities have failed to respond to Trump and other geopolitical-induced uncertainties while adhering to improving earnings, relaxing regulations, and concerted global economic growth.
This alternative is centered on dampening the economic growth and inflation components of TIPS breakevens. This may sound strange, but TIPS breakevens are greatly impacted by financial stress and liquidity concerns in addition to inflation expectations. TIPS breakevens tend to widen with U.S. Treasury term premiums when uncertainty is on the rise and economists’ forecasts show higher dispersion (i.e. greater ranges). We are interested in the remainder after subtracting the economic growth and inflation baked into commodities from TIPS breakevens.
The second panel in the chart below shows the spread in rolling 90-day returns for the Barclays US TIPS Duration Hedged Total Return index minus the Bloomberg Commodities ex-Precious Metals index. The commodities component is weighted by a comparison in daily return volatility over the previous year.
This ‘uncertainty hedge’ has better-tracked uncertainty measures in recent years. TIPS breakevens may indeed offer more clues away from just inflation.
