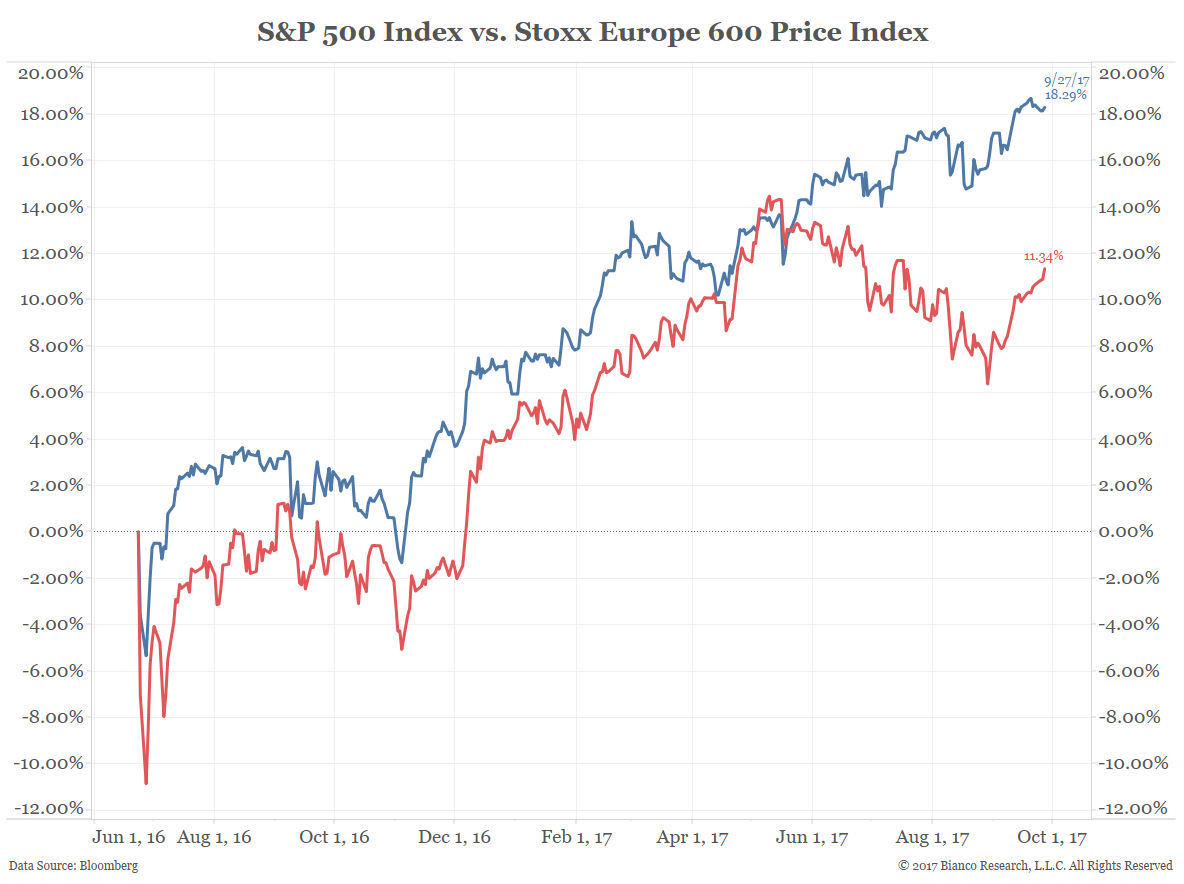
As the chart below shows, shortly after the Brexit vote last year both the Stoxx Europe 600 (red line) and the S&P 500 (blue line) fell sharply. After that initial fall, they have advanced 11.34% and 18.29%, respectively.
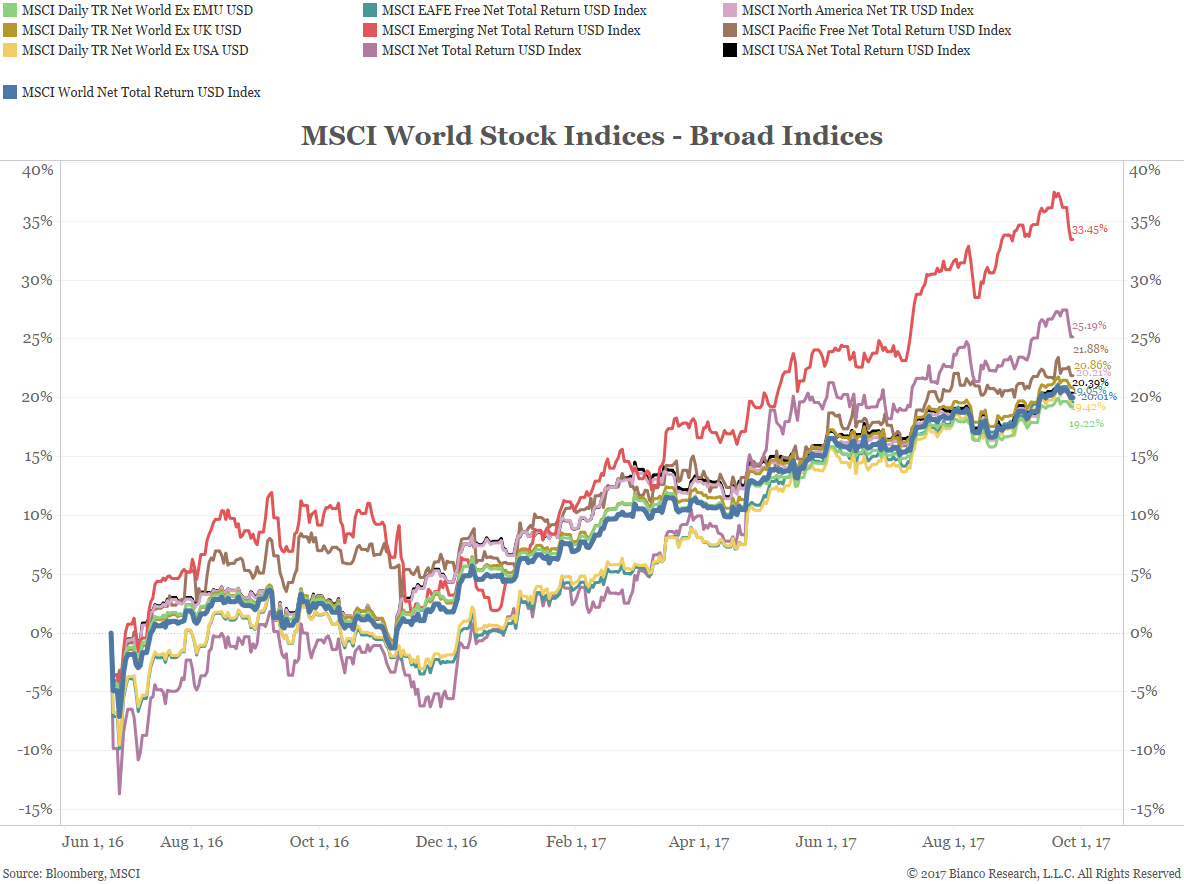
The MSCI World Stock Indices are all also up after initially falling. The MSCI World Index (blue line below) is up 20% while the MSCI Emerging Market Index (red line below) is up 33.45%.
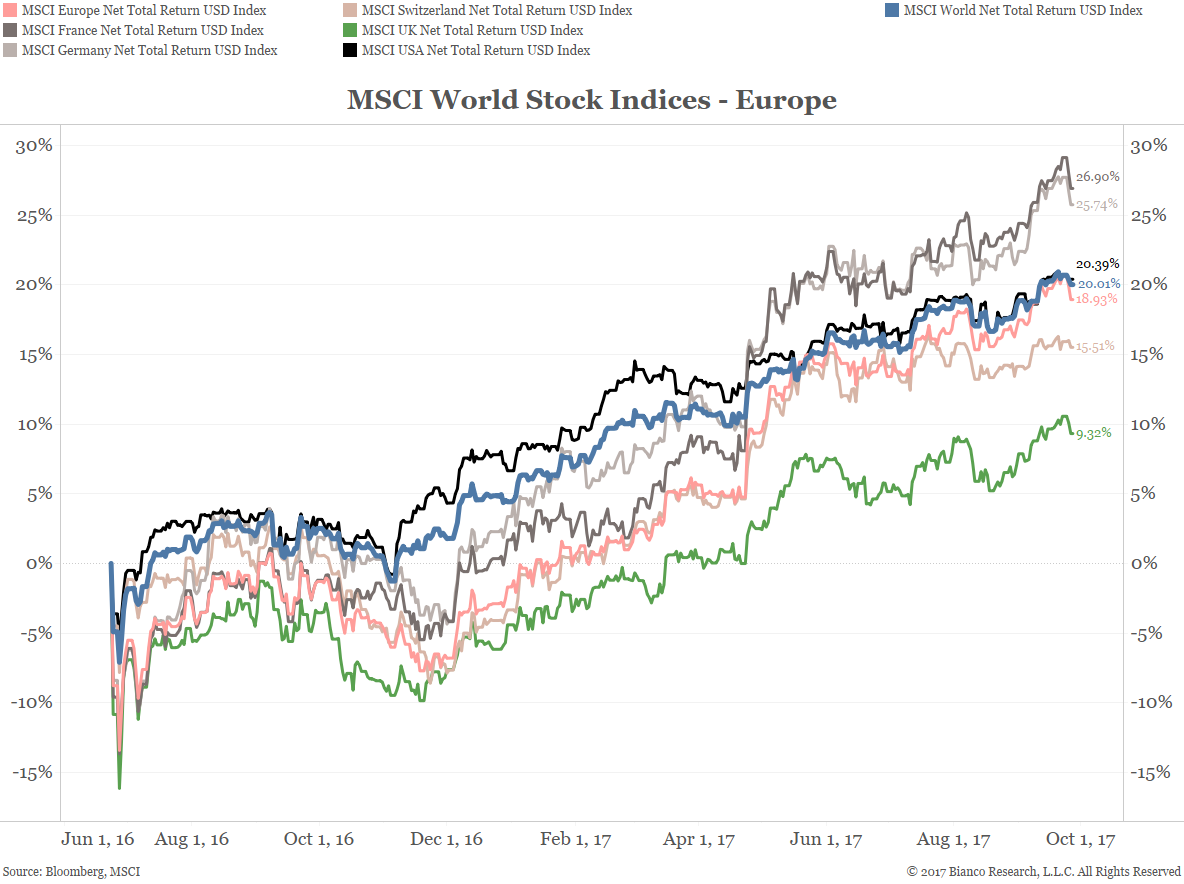
European stocks have followed a similar pattern. However, the U.K. (green line below) lags the rest of the countries in Europe, up just 9.32% since the Brexit vote.
Use the interactive chart below to view returns for all the MSCI stock indices.