Comment
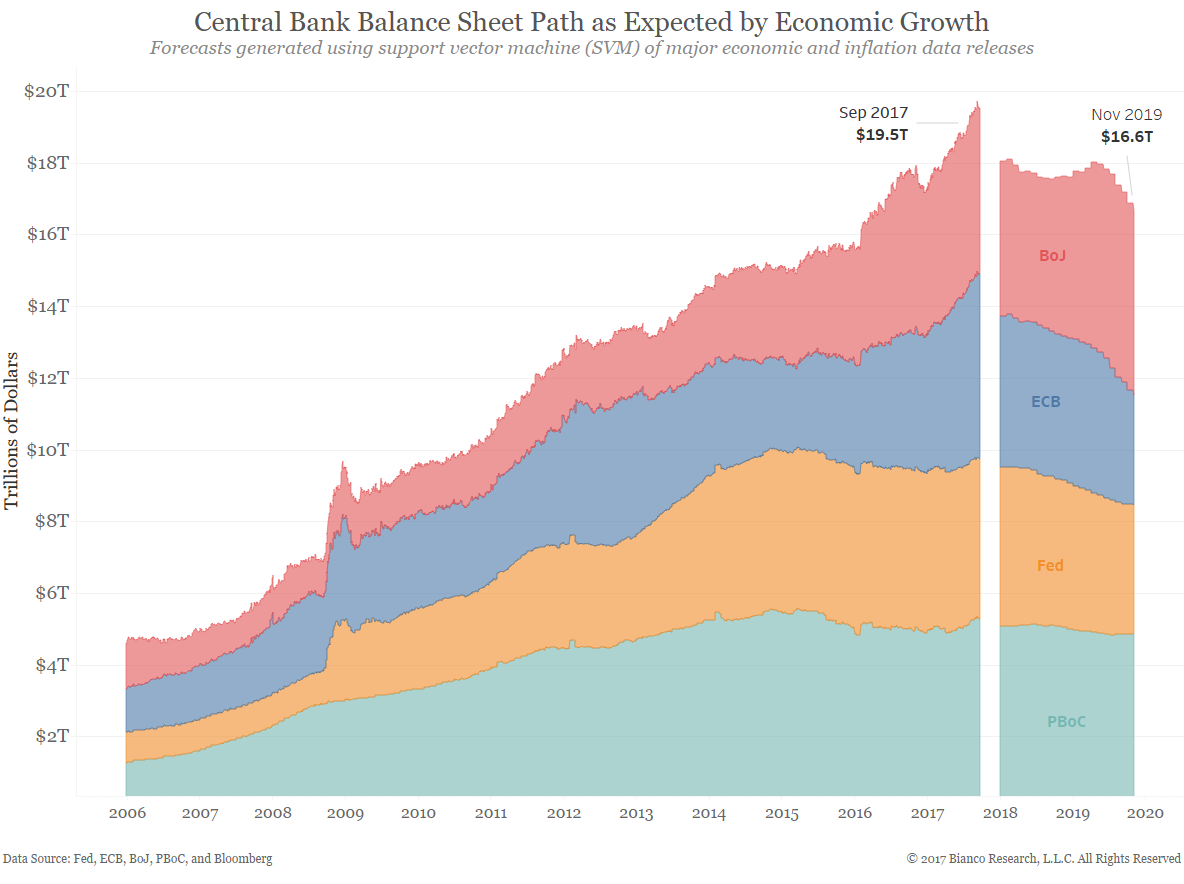
The next chart shows the same forecasts, however stacked to indicate totals across the big four central banks. Total balance sheet assets are expected to drop from a current $19.1T to $16.6T by November 2019. In reality, a drop of $2.5T is quite marginal. Investors seemingly understand the process of ‘normalization’ will be a long one, especially in the event a recession were to hit in the coming five years.
What could make this change? Easy, inflation.
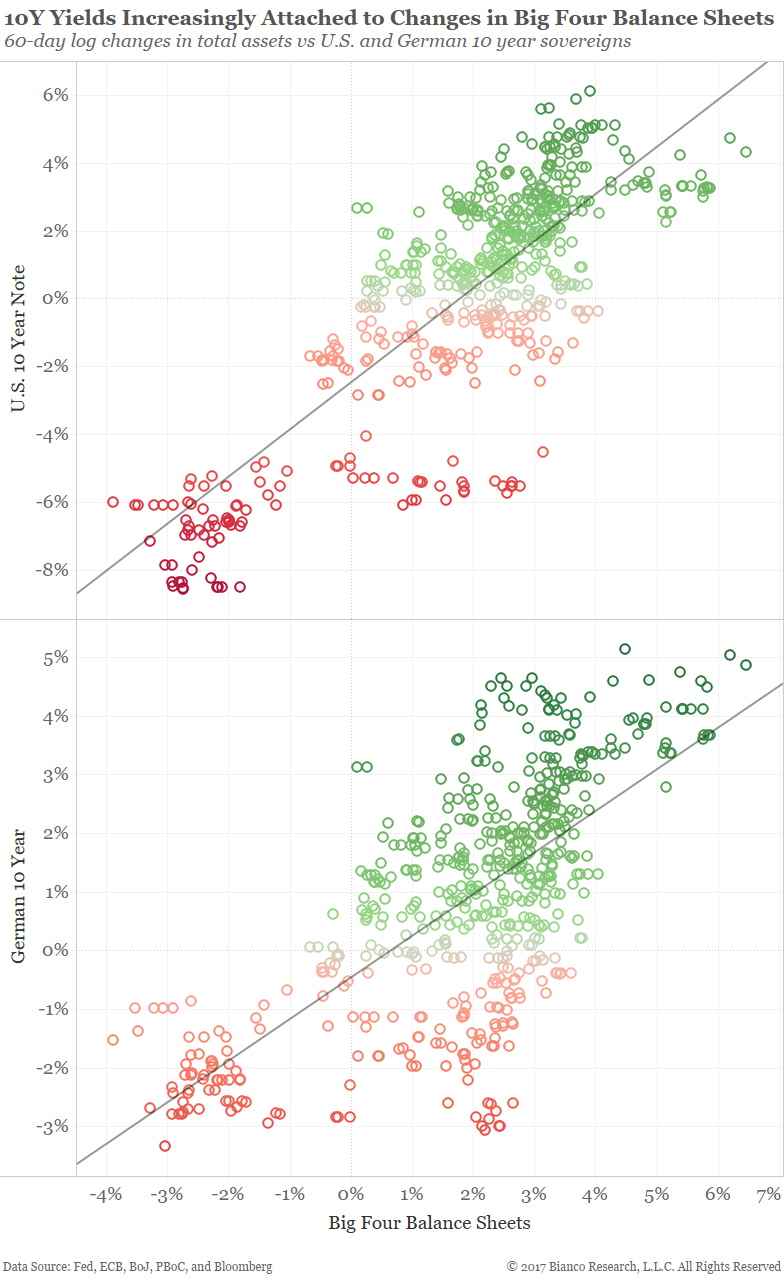
Sovereign yields have become increasingly attached to changes in total assets held by the big four central banks. The scatterplots below show 60-day log changes in total assets versus returns for U.S. and German 10 year sovereigns since 2016.
A continued rise in the BoJ’s balance sheet will likely be washed out by a reduction by the Fed. What Draghi decides for the ECB is likely most important for yields going forward. An ECB reducing assets alongside the Fed in 2018 would bring down total assets held by the big four central banks and finally drive yields higher.
The great unknown is when other central banks will join the chorus. Hawkish rhetoric is on the rise outside U.S. borders. But, action speaks louder than words…
The direction of equity returns have remained dictated by economic growth, however insulation to negative developments and a positive beta to positive developments have very likely been provided by continued monetary stimulus across the globe.
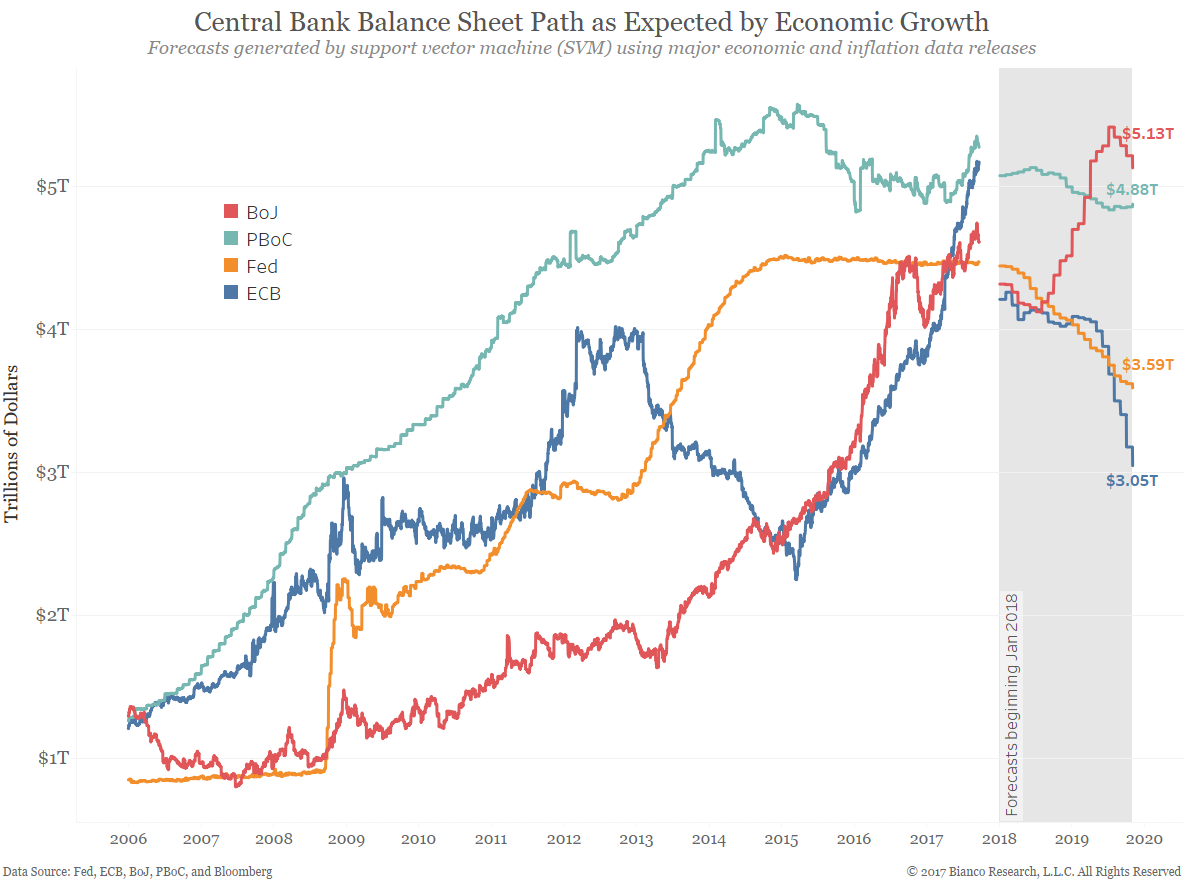
What if economic and inflation growth were allowed to mechanically determine the impending unwind of Fed, ECB, BoJ, and PBoC balance sheets?
The chart below shows forecasts for 2018 through 2019 based on major economic and inflation data releases.
Quick takeaways: