Comment
‘Neutral’ Rate Dropping, Are Tighter Financial Conditions Finally on the Way?
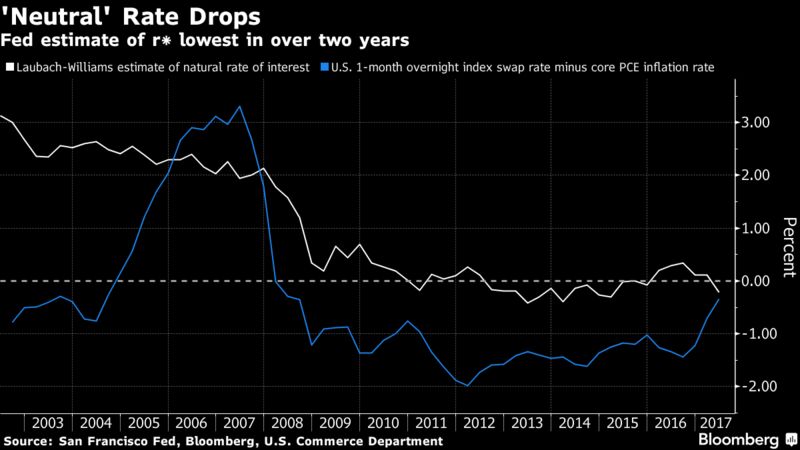
- Bloomberg – Fed Neutral Rate Estimate Drops, Lowest in Over Two Years
The so-called neutral U.S. interest rate fell in the second quarter by the most since 2010, according to a widely-cited estimate produced by Federal Reserve economist Thomas Laubach and San Francisco Fed President John Williams. The theoretical rate known in economic circles as “r-star” — which is adjusted for inflation and would neither stimulate nor restrict an economy growing at its trend pace — declined to -0.22 percent, from 0.12 percent in the first quarter. In comparison, the Fed’s benchmark rate, adjusted for core inflation, is currently -0.35 percent, which suggests the central bank is nearly at a “neutral” monetary policy setting, according to the model. - Bloomberg – Fed Balance Sheet Policy May Amount to More Easing
The structure of the bond market these days is such that there’s a good chance financial conditions will continue to loosen.Surely that will cause long-term yields to rise and financial conditions to finally tighten, right? Maybe not. The structure of the bond market these days is such that there’s a good chance conditions will continue to loosen, further underpinning demand for riskier assets ranging from equities to high-yield debt to emerging-market currencies. To understand why, first consider that institutions that needed very high quality securities to comply with new regulations designed to make the financial system safer have been somewhat crowded out by the Fed’s purchases. They will now have the opportunity to buy Treasuries and the resulting demand should help contain long-term yields. At the same time, officials such as New York Fed President William Dudley have hinted there will be a pause in rate hikes during the initial stages of balance-sheet normalization, which should also help support the market.
Summary
Comment
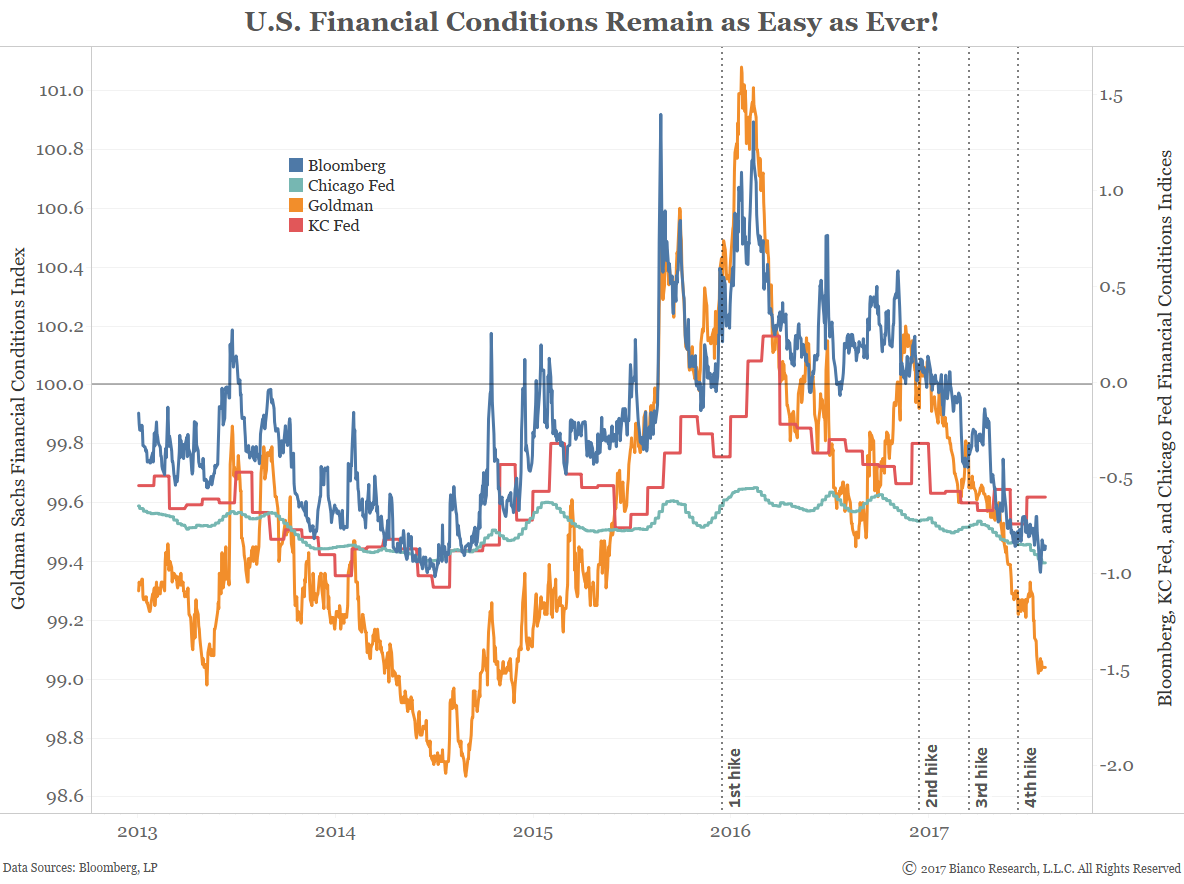
The recent drop in the neutral interest rate or r* suggests further tightening will finally result in just that, tighter financial conditions. However, theories abound as to why balance sheet reduction will lead to further easing (second article above) akin to the past four rate hikes.
The chart below shows major financial conditions indices along with rate hikes (vertical dashed lines).
However, the estimation of thresholds like the neutral or reversal rates are quite fuzzy and difficult, especially considering the shifting dynamics of inflation.
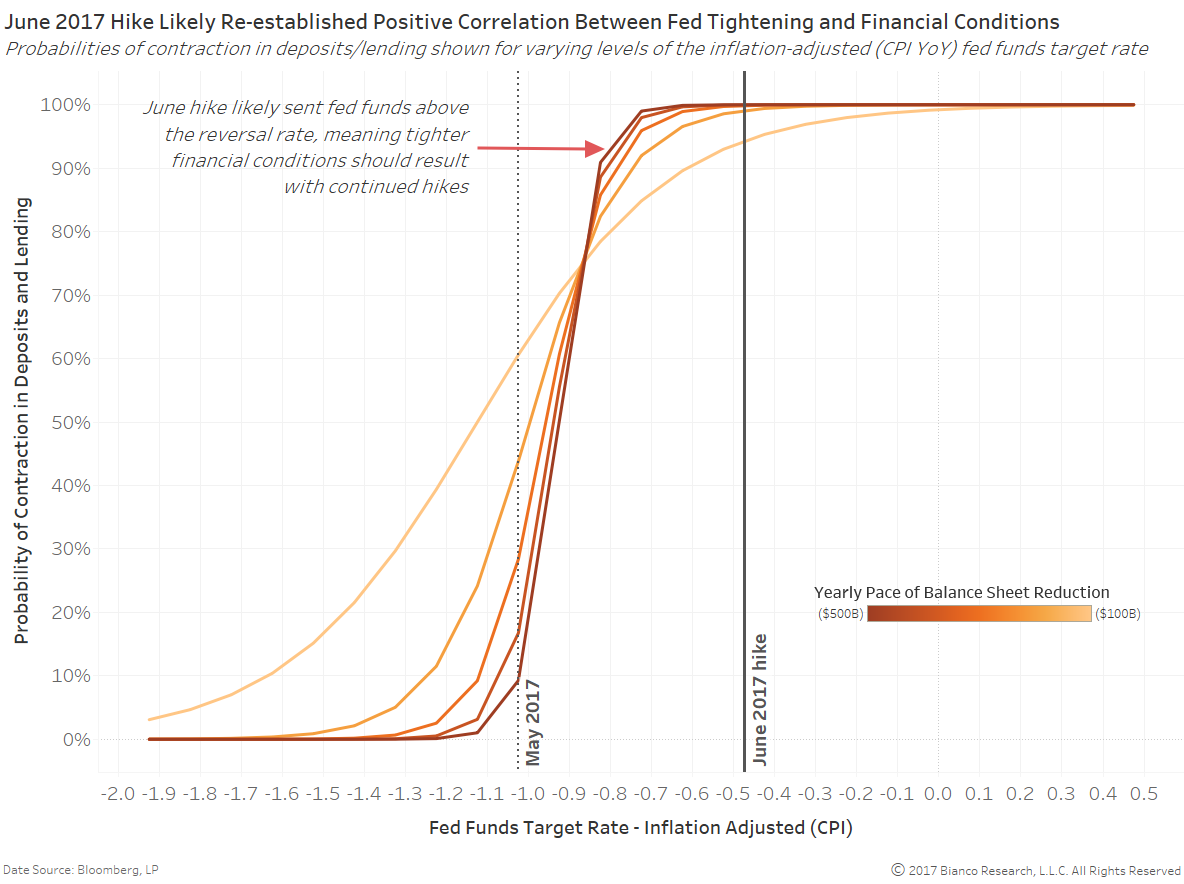
Our own analysis sides with the determination of r* by Laubach and Williams. We stress test for contractions in deposits and lending using both varied fed funds target rates adjusted for inflation AND paces of balance sheet reduction ranging from $0 to $500 billion per year.
The chart below shows model output with each line representing an assumed pace of balance sheet reduction. The June 2017 hike suggests any pace of balance sheet reduction should lead to tighter financial conditions via contracting deposits and lending, even in the absence of further rate hikes.
U.S. Treasury term premiums have offered a reflection of the bond investor’s conviction in a low growth and inflation outlook. Barring a mistake by the Federal Reserve and declining inflation, balance sheet reduction should show up in higher term premiums.
ECB Likely the Most Watched Central Bank in 2018
- Reuters – Fed balance sheet plan may equal three rate hikes for emerging markets
According to calculations by IIF, one of the most authoritative trackers of global capital flows, this will slice just over $200 billion off the U.S. central bank’s balance sheet next year, assuming it keeps reinvesting some of the money for the time being. Sonja Gibbs, one of the IIF’s senior directors, also estimates that just a $65 billion drop in the Fed’s Treasury holdings would equate to a $6.5 billion to $7 billion drop in emerging market portfolio flows — bond and equity purchases by foreigners — all else being equal. “That in turn is about equal to a 25 basis point (Fed) rate hike in terms of impact,” Gibbs added. - The Wall Street Journal – The Great Transatlantic Bond Divergence Unwind
The spread between U.S. and German bonds is narrowing, but this important indicator of global financial conditions has a long way to goWhere policy goes now is key. Markets doubt how far the Fed might get with its tightening, and seem unflustered by the prospect of the central bank shrinking its balance sheet. Investors may be too relaxed, but in the absence of fiscal stimulus and inflation, much higher yields for Treasurys might be hard to achieve in the near term. The European Central Bank, meanwhile, is set to move out of emergency-policy territory. Support for low yields on German bunds is likely to diminish as the ECB starts to move gently towards an exit from its bond purchases. While policy rates are likely to remain ultra-low for a long time to come, that implies a steeper yield curve in Germany, with the central bank exerting less influence over longer-term interest rates.
Comment
Financial markets are taking in stride the Fed’s plans to begin reducing its balance sheet. The great unknown at the moment is when will other central banks join the chorus? The direction of equity returns have remained dictated by economic growth, however, insulation to negative developments and a positive beta to positive developments have very likely be provided by continued monetary stimulus across the globe.
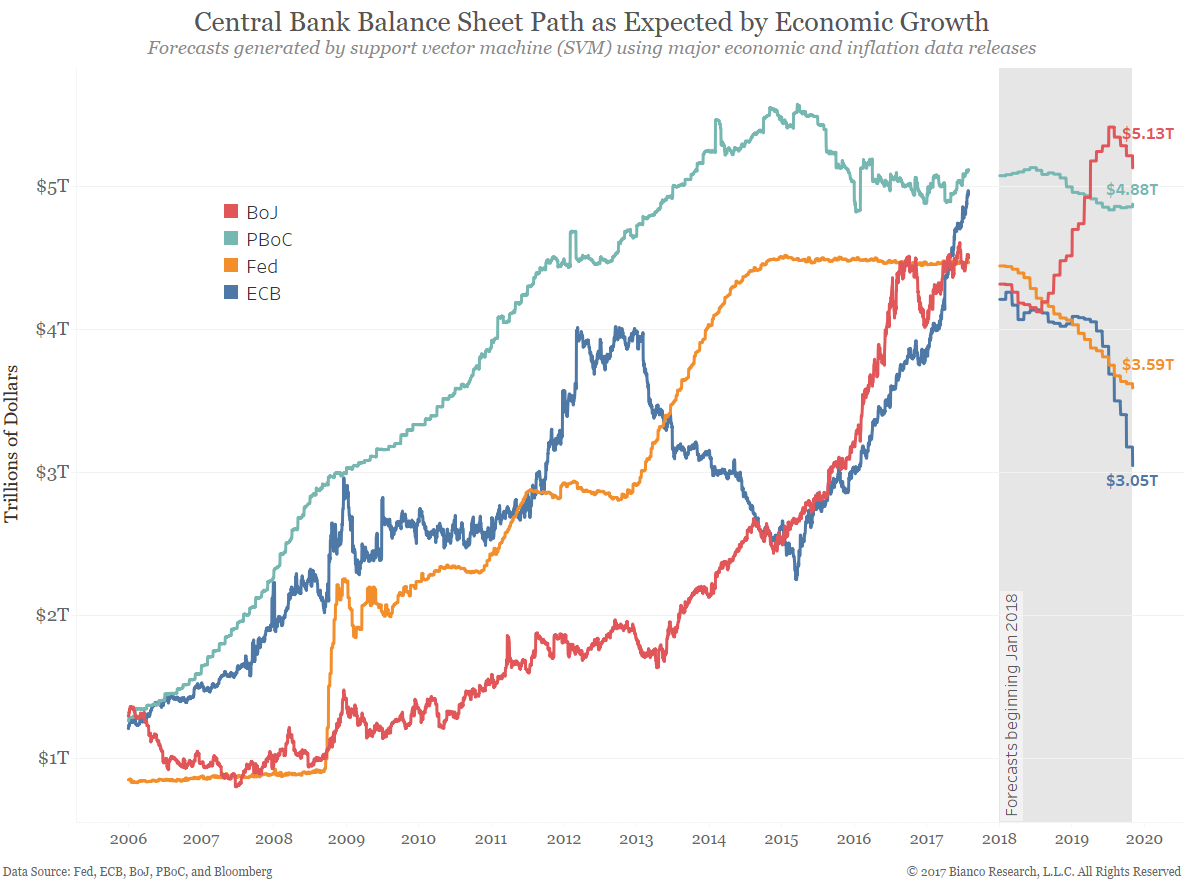
What if economic and inflation growth were allowed to mechanically determine the impending unwinding of Fed, ECB, BoJ, and PBoC balance sheets?
The chart below shows forecasts for 2018 through 2019 based on major economic and inflation data releases.
Quick takeaways:
- Eurozone’s recent economic improvements suggest a much lower balance sheet by the end of 2019 near $3.05T
- US’ slower pace of gains points to a modest $0.88T reduction over the same time frame
- Continued lack of inflation in Japan indicates the BoJ’s balance sheet could continue rising toward $5.13T
- PBoC is expected to maintain a stable balance sheet near $4.88T
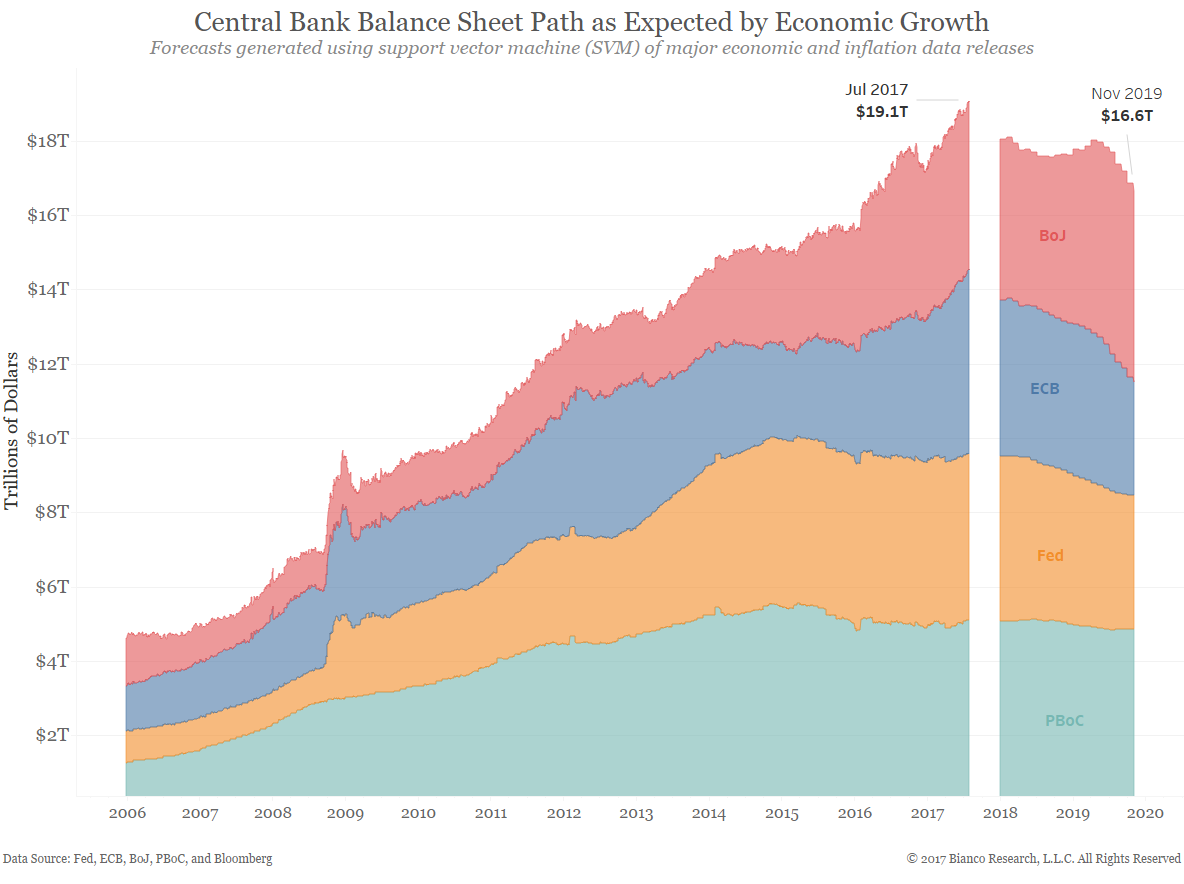
The next chart shows the same forecasts, however, stacked to indicate totals across the big four central banks. Total balance sheet assets are expected to drop from a current $19.1T to $16.6T by November 2019. In reality, a drop of $2.5T is quite marginal. Investors seemingly understand the process of ‘normalization’ will be a long one, especially in the event a recession were to hit in the coming five years.
What could make this change? Easy, inflation.
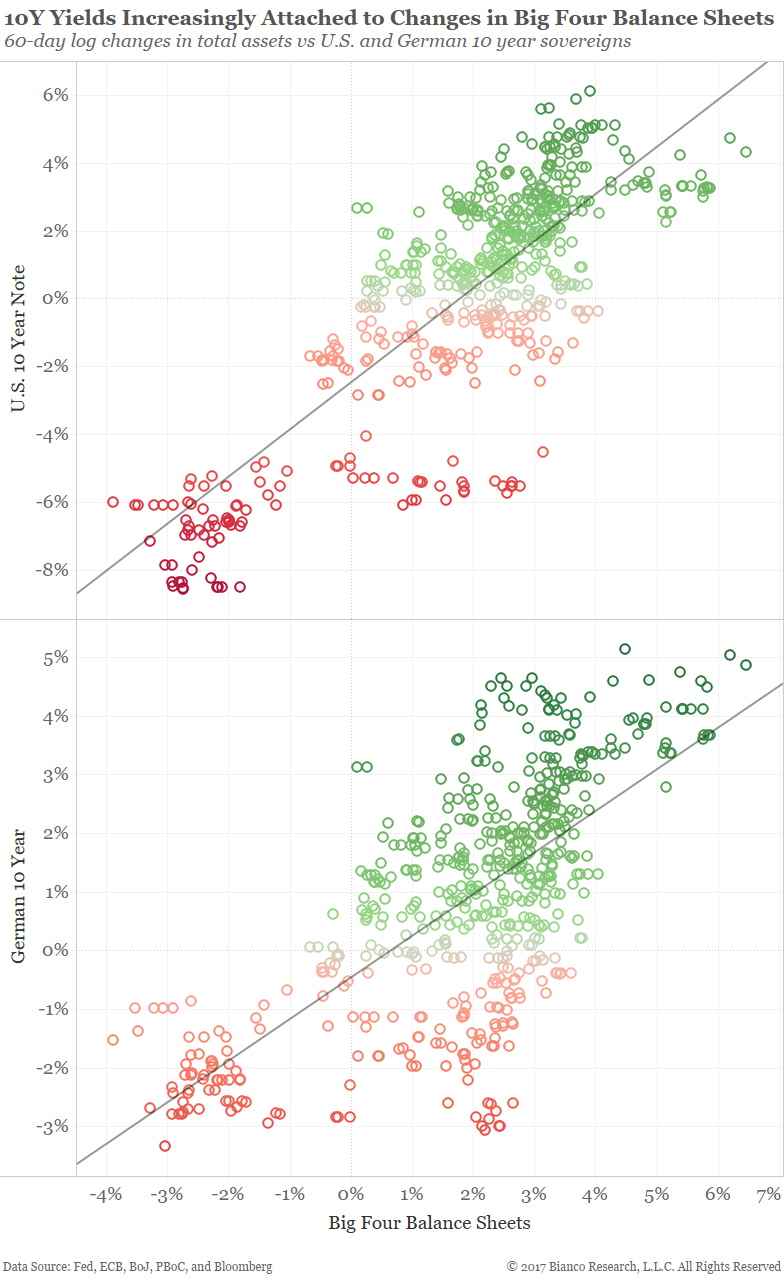
Sovereign yields have become increasingly attached to changes in total assets held by the big four central banks. The scatterplots below show 60-day log changes in total assets versus returns for U.S. and German 10 year sovereigns since 2016.
A continued rise in the BoJ’s balance sheet will likely be washed out by a reduction by the Fed. What Draghi decides for the ECB is likely most important for yields going forward. An ECB reducing assets alongside the Fed in 2018 would bring down total assets held by the big four central banks and finally drive yields higher.
U.S. Treasuries Need a Wellness Check
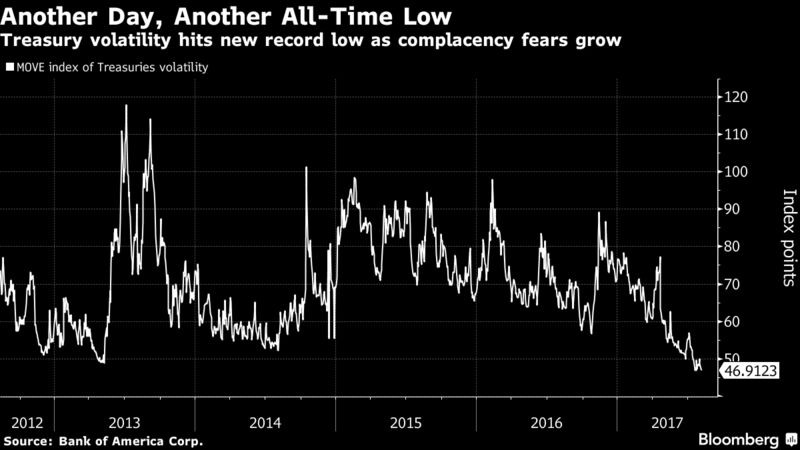
- Bloomberg – Volatility Gauges Tumble to New Lows Amid Complacency Fears
Bank of America MOVE Index closes at an all-time low on Monday
The markets are alive with the sound of ‘zzzzzz’ as the latest trading session marks yet another another record low for volatility gauges. Bank of America’s MOVE Index, which gauges volatility in the U.S. Treasury market, has tumbled to an unprecedented 46.9 at the close of Monday’s trading session. The move means investors in the world’s largest bond market are shrugging off the potential for price swings, even as two titans of the industry up their bets on an uptick in U.S. inflation.
Summary
Comment
There is a laundry list of events and variables helping sink volatility in recent years. However, we have focused a lot on the rise of what we call the ‘era of ubiquitous and accessible information.’ The variability of economic data is severely low, which may be both the product of a stable economy and better means of recording its growth.
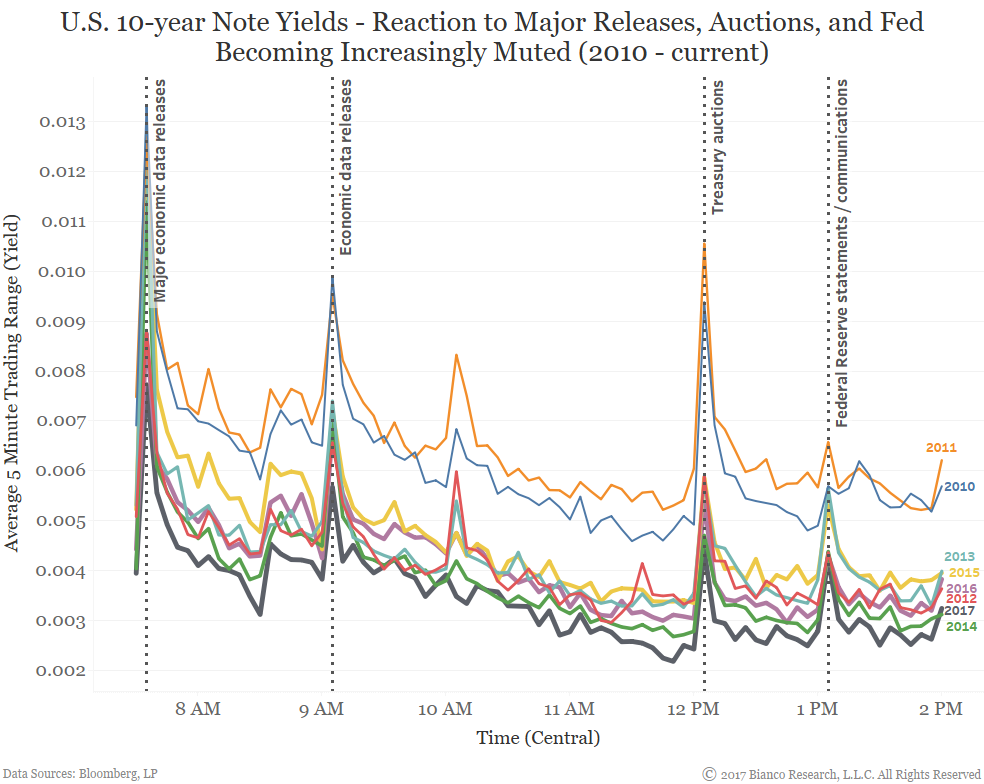
Namely, U.S. Treasuries are no longer reacting so strongly to events throughout the trading day. The chart below shows average trading ranges over five-minute intervals by U.S. 10-year note yields from 2010 to current. Note all times are central.
The darkest line at the bottom shows 2017 as the least volatile, especially during major events denoted by the dashed vertical lines. For example, during Treasury auctions yields have traded in ranges roughly one-third of the years directly following the financial crisis.
Additionally, since 2012 a vast majority of trading action takes place in the first two hours (7:30 – 9:30 am) while giving way to very muted late morning and afternoon sessions.
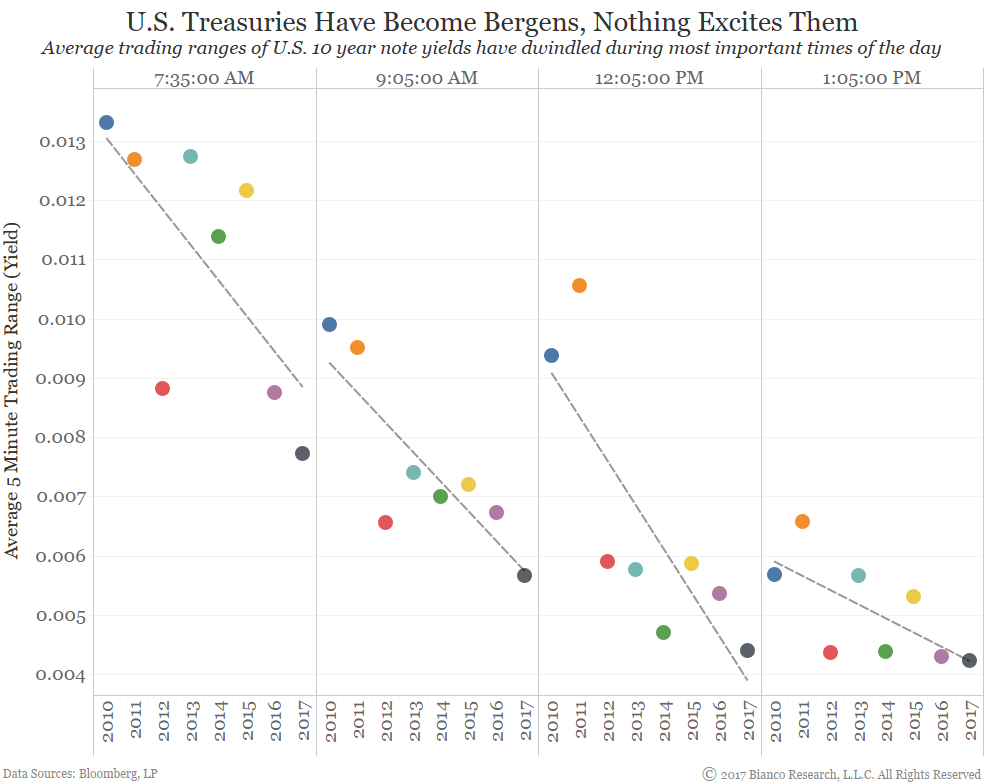
The next chart focuses exclusively on five-minute intervals following the normal times of major economic data releases at 7:30 and 9:00 am, Treasury auctions at 12:00 pm, and Federal Reserve communications at 1:00 pm.
The trend lines show the drop in the average reaction by U.S. Treasuries. One of my children’s favorite DreamWorks’ motion pictures, Trolls, includes nasty beings called Bergens. These Bergens provide no reaction or excitement to anything shown before them. U.S. Treasuries have also become just as aloof and lethargic.
History suggests volatility is mostly a function of changes in global economic growth, inflation, and central bank action (see our model here). All three variables are lacking volatility and excitement, which should provide no surprise equity and sovereign volatility are painfully low. If economic data volatility and, likely, more importantly, inflation have made a structural shift to lower levels given technological disruptions, then this era of ultra-low volatility may persist for some time.
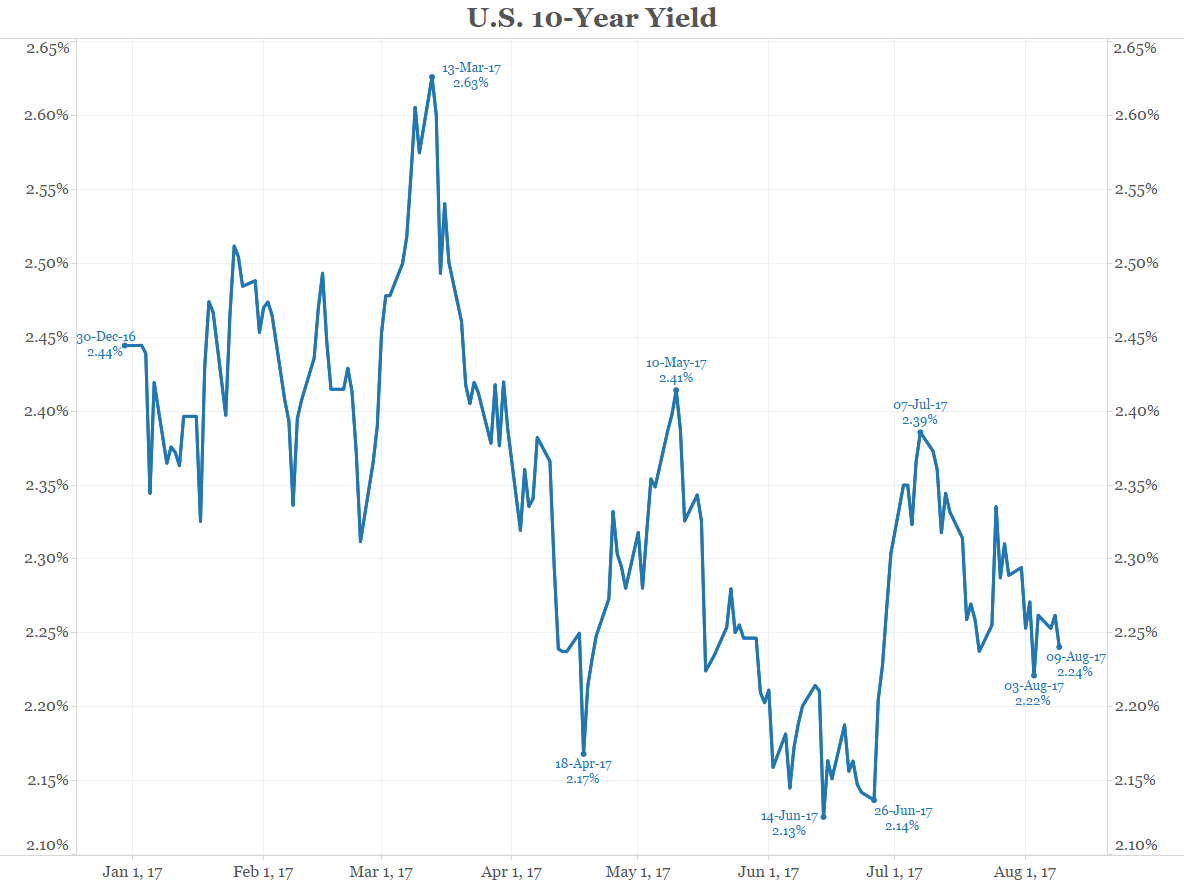
At the beginning of the year, the Wall Street’s consensus was for rates to go higher. The question was “when will 10-year yields hit 3%?”, not if. Predictably rates have gone the other way and are lower now than the start of the year. See the first chart below.
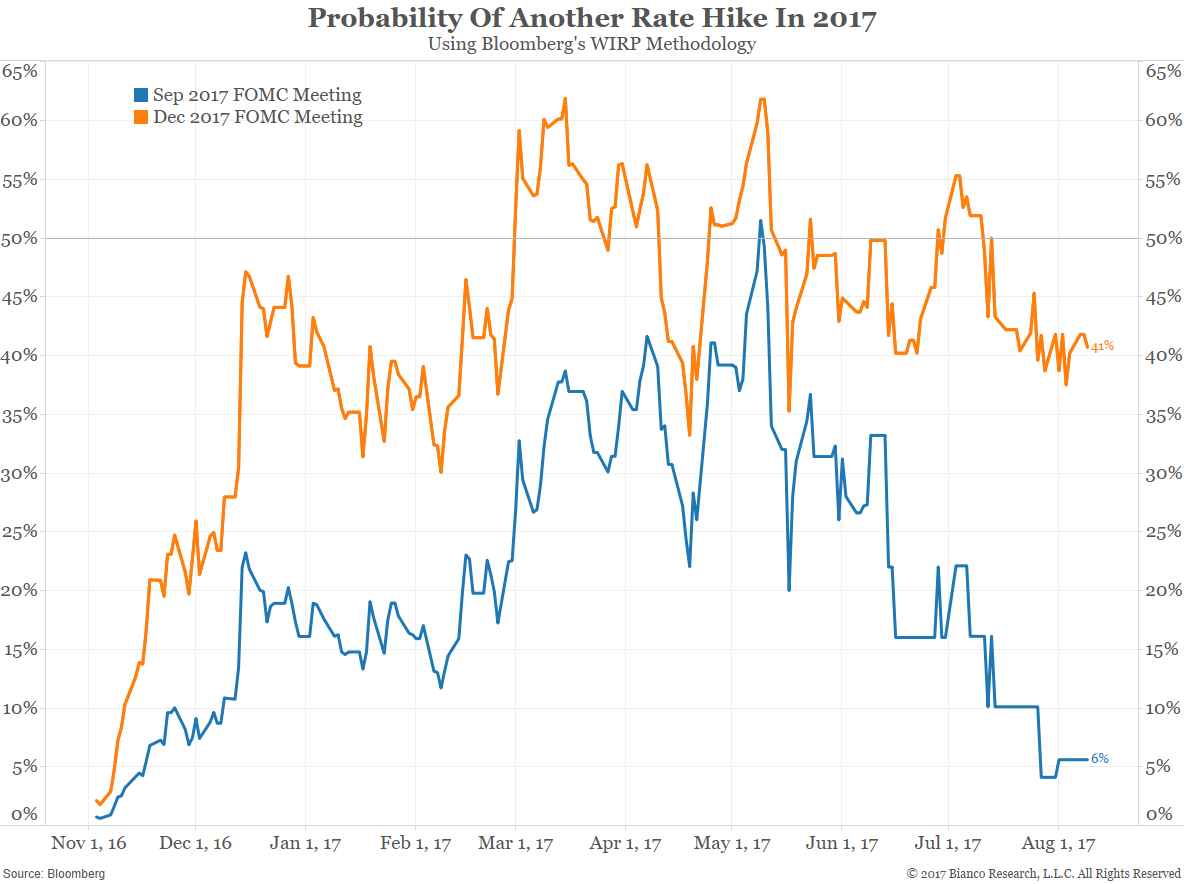
The next two charts show what the market expects from the Fed. The probability of a rate hike in September is approaching zero as the market expects the Fed to announce balance sheet reductions, and not rate hikes, at this meeting. December is now less than 50% meaning a rate hike is also not expected at this meeting.
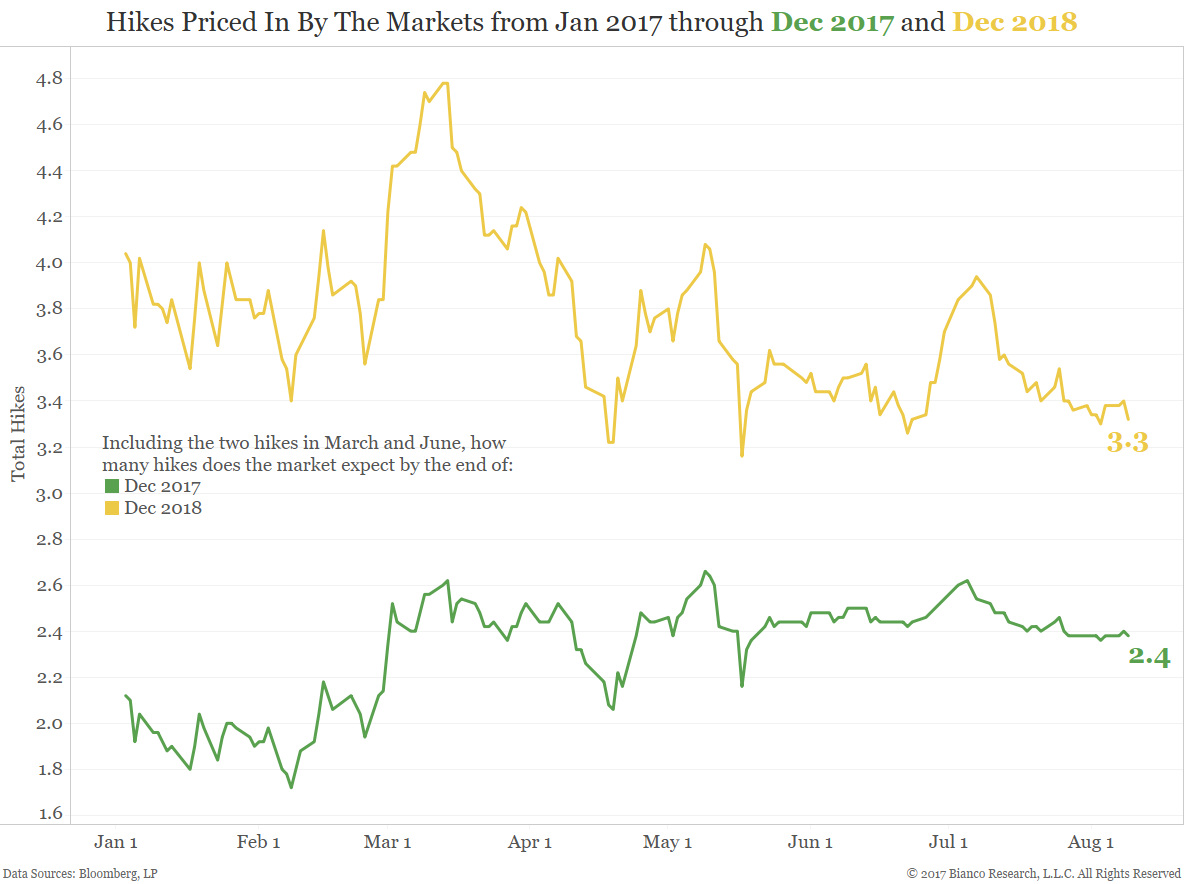
Expressed differently, see the third chart below. Two rate hikes are already done this year (March and June). The market only expects 0.4, or less than half a rate hike the rest of his year. It is pricing in 1.3 rate hikes through the end of 2018. This stands in contrast to the latest Fed “dot” chart that says 1 rate hike this year and 3 next year. In January 2016 when the Fed dots said 4 rate hikes and the market priced in less than 2 rate hikes, the Fed “caved” to market expectations and hiked only once in December 2016.
Unless/until the data changes, the market expects something similar again. Less Fed rate hikes are supportive for bond prices and help to explain lower rates.