- Macro Musings – James Bullard on Life as a Fed Bank President and Monetary Policy in 2017
In this week’s episode, Jim Bullard, the president and CEO of the Federal Reserve Bank of St. Louis, joins the show to discuss his work as a Federal Reserve executive and as a researcher in monetary policy. Bullard shares his thoughts on why inflation has been so persistently low since 2008 and whether the Fed should pursue a more symmetric inflation target. He and David also discuss the Fed’s plans for monetary policy in 2017. In Bullard’s view, the Fed should focus on reducing its balance sheet before it turns to raising rates further. - Bloomberg – The Fed Could Take a Summer Vacation
March data has shown a slowing of inflation, as well as growth, which takes pressure off the Fed in its push to fulfill half of its dual mandate — that of containing inflation. In data released April 14, the total and core consumer price index fell month over month, though they remain up year over year. Although the Fed uses the core PCE for policy purposes, the drop in core CPI to 2 percent is dovish for Fed policy and bearish for the dollar, since this is the lowest level of core inflation since October 2015.
Comment
Bullard openly discusses his views concerning a needed symmetrical approach to inflation targeting in the podcast above. Wages and inflation have yet to feel the impact of a tight labor market as foretold by the Phillips curve. However, allowing inflation to run hot in excess of 2% is not on Bullard’s agenda.
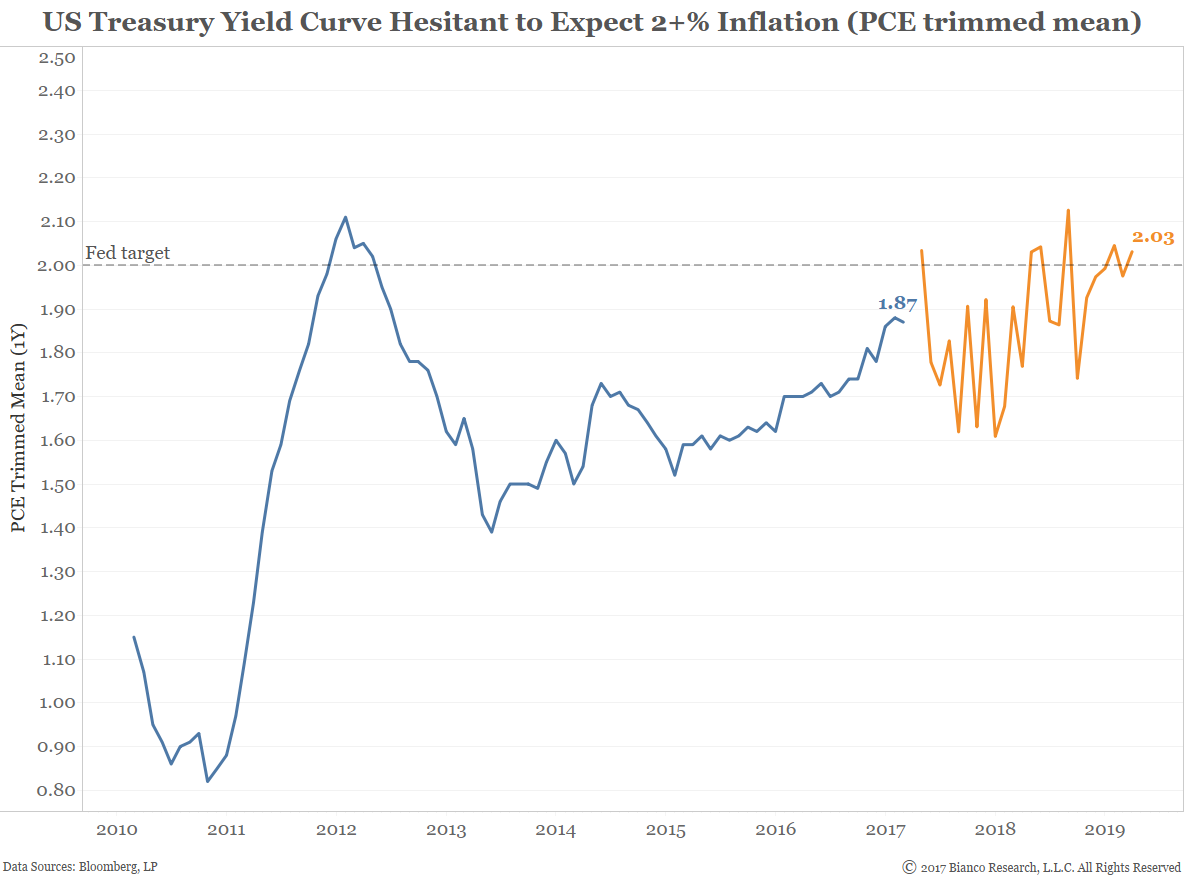
U.S. Treasuries have been very hesitant to discount inflation above the Fed’s target. The chart below shows the annual rate of inflation discounted for the next two years by the U.S. Treasury yield curve in orange. We use the Dallas Fed’s trimmed mean PCE inflation annual rate (blue line), which Bullard and others suggest is a better estimate of core inflation than the traditional ‘ex food and energy.’ Total returns and spreads across all maturities are fed into a model (gradient boosted trees) to produce inflation estimates.
U.S. Treasury yields are suggesting inflation will struggle to exceed the Fed’s target through at least early 2019.
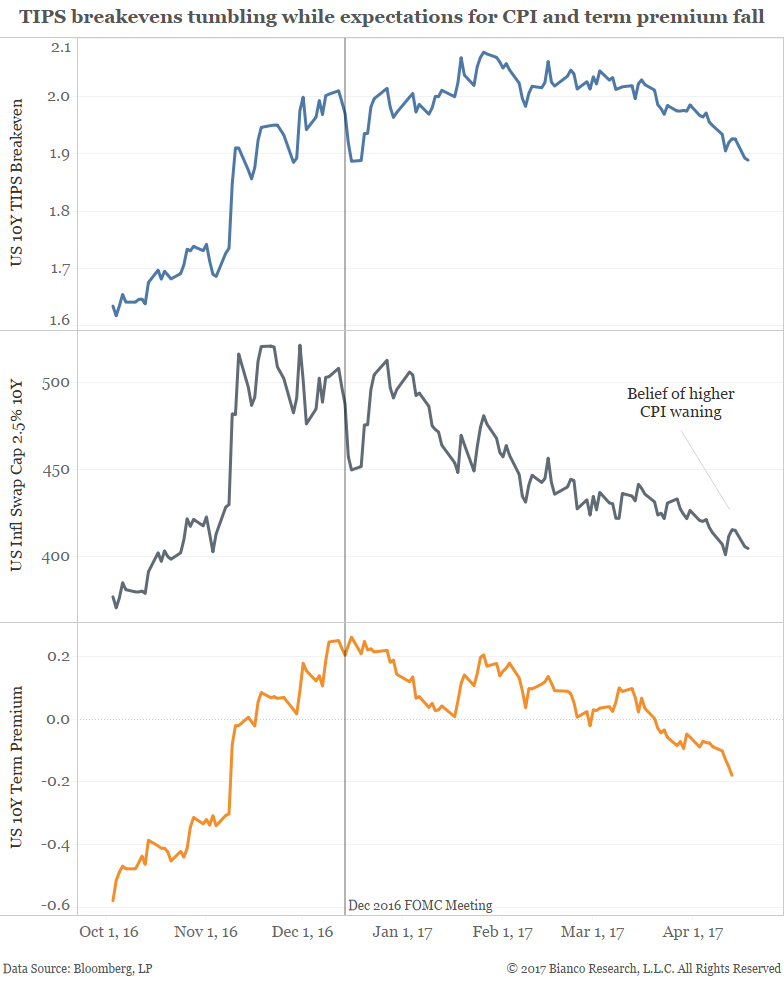
A lack of fear over inflation as evidenced by now tumbling inflation expectations coupled with the Fed’s balance sheet have suppressed the long-end of the U.S. Treasury yield curve. The chart below shows U.S. 10-year TIPS breakevens (blue), inflation swap cap 2.5% (gray), and term premium (orange).
The demise of the Trump reflation trade has fewer and fewer expecting hard (realized growth) data will rise to meet lofty soft (survey) data. We are already seeing a rebound in implied volatility across risk markets even while realized remains eerily subdued.
One argument we have made is U.S. Treasuries have found more certainty in a slow pace of growth and inflation as evidenced by lower term premiums. The bond market is coming to terms with Trump’s shortcomings and a wish-washy Federal Reserve. This is in opposition to an equity market still all too hopeful for improving consumer and government spending.
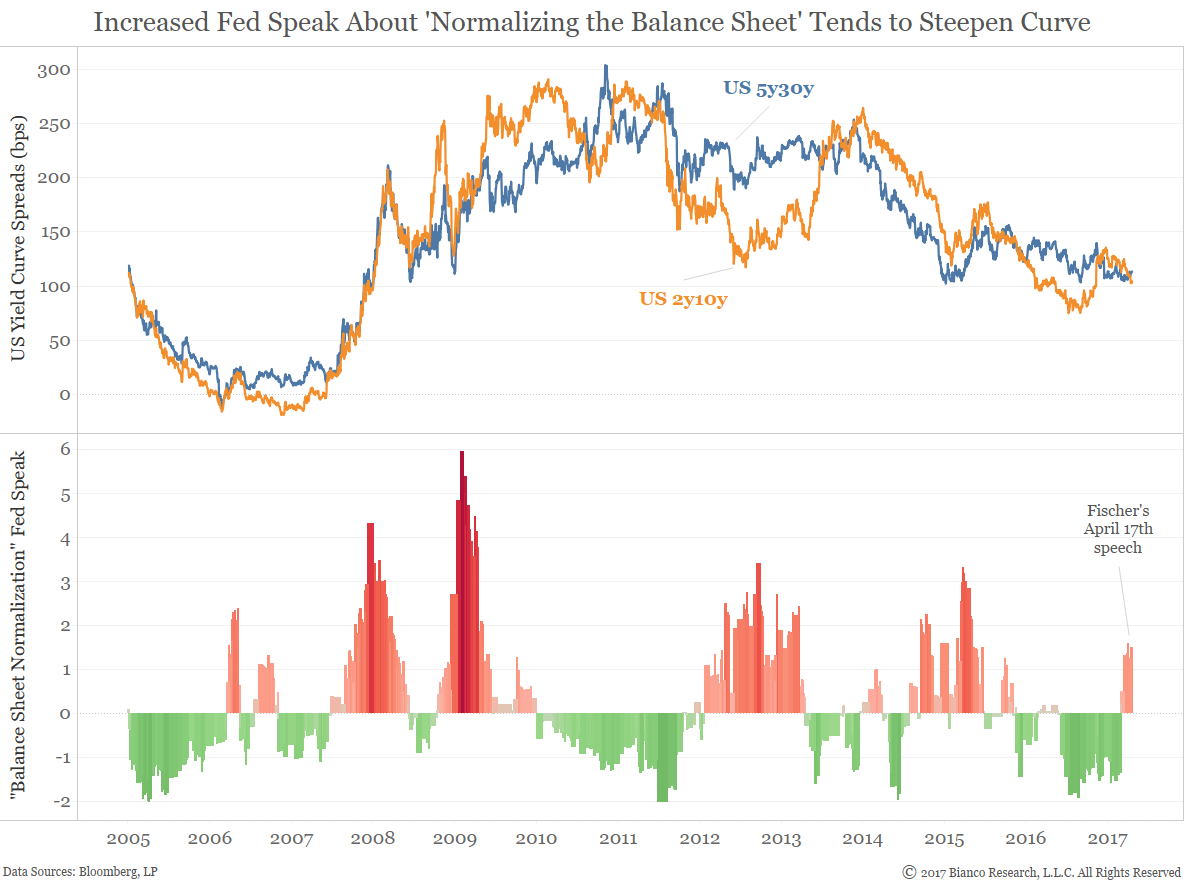
The chart below shows the U.S. 2y10y and 5y30y spreads in the top panel and an index for Fed speak of ‘balance sheet normalization’ in the bottom panel. We cite a comprehensive record of Fed speak incorporating all official speeches, meeting minutes, and press conferences.
Federal Reserve officials have been discussing the balance sheet by their most since mid-2015. The U.S. yield curve has needed these discussions (i.e. hope of balance sheet reduction) to steepen in years past.
Will the Federal Reserve look to limit the twist of the yield curve and diminish potential of inversion by finally allowing balance sheet run-off? The U.S. yield curve is very hesitant to become a believer.
Unfortunately, U.S. Treasury investors are stuck in limbo until the direction of inflation becomes more concrete and the Federal Reserve better communicates their balance sheet intentions.