
Comment
- CNBC – David Tepper: ‘You bet your heinie’ I’m short bonds
Following a sharp run-up in bond yields since the summer, hedge fund manager David Tepper told CNBC he thinks prices still have room to drop. Asked whether he is short bonds, the Appaloosa Management founder replied: “You bet your heinie.” The benchmark U.S. 10-year Treasury note yield has risen sharply after hitting a 52-week low in July of 1.36 percent. It has since rebounded to trade above 2.55 percent amid stronger economy data and expectations of higher inflation and tighter U.S. monetary policy. Yields increase as bond prices fall. While yields have risen sharply, Tepper said Wednesday, “We’ve got a lot of room until we have to worry.” - The Wall Street Journal – Selloff in U.S. Government Bonds Deepens
Over the past week or so, a series of jawboning from the Federal Reserve officials shifted the bond market’s focus toward the central bank’s tightening policy again. Investors repriced the interest rates by selling Treasurys. The 10-year yield has risen by nearly 0.2 percentage point this month after logging the first monthly decline in February since last July, when the yield closed at a record low of 1.366%. “Sentiment has been negative for the bond market” given the repricing of the Fed outlook, said Charles Comiskey, head of Treasury trading at Bank of Nova Scotia in New York. “It is just a question of when’’ for the 10-year yield to break above 2.6%, he said. Donald Ellenberger, money manager at Federated Investors, said he expects the Fed to raise rates three times this year and that the 10-year yield would rise to 3% by the end of December, a level the yield last traded in January 2014.
Comment
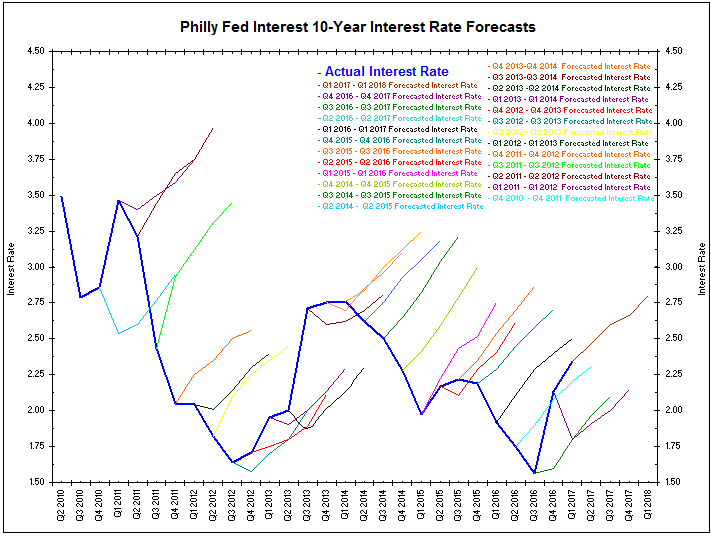
The blue line in the chart below shows 10-year yields. The various colored lines show quarterly forecasts for 10-year yields from the Philadelphia Federal Reserve’s “Survey of Professional Forecasters.”
All 24 forecasts start in line with current yields and head higher. In other words, since 2010 the consensus of professional forecasters has always been bearish on bonds (higher yields).
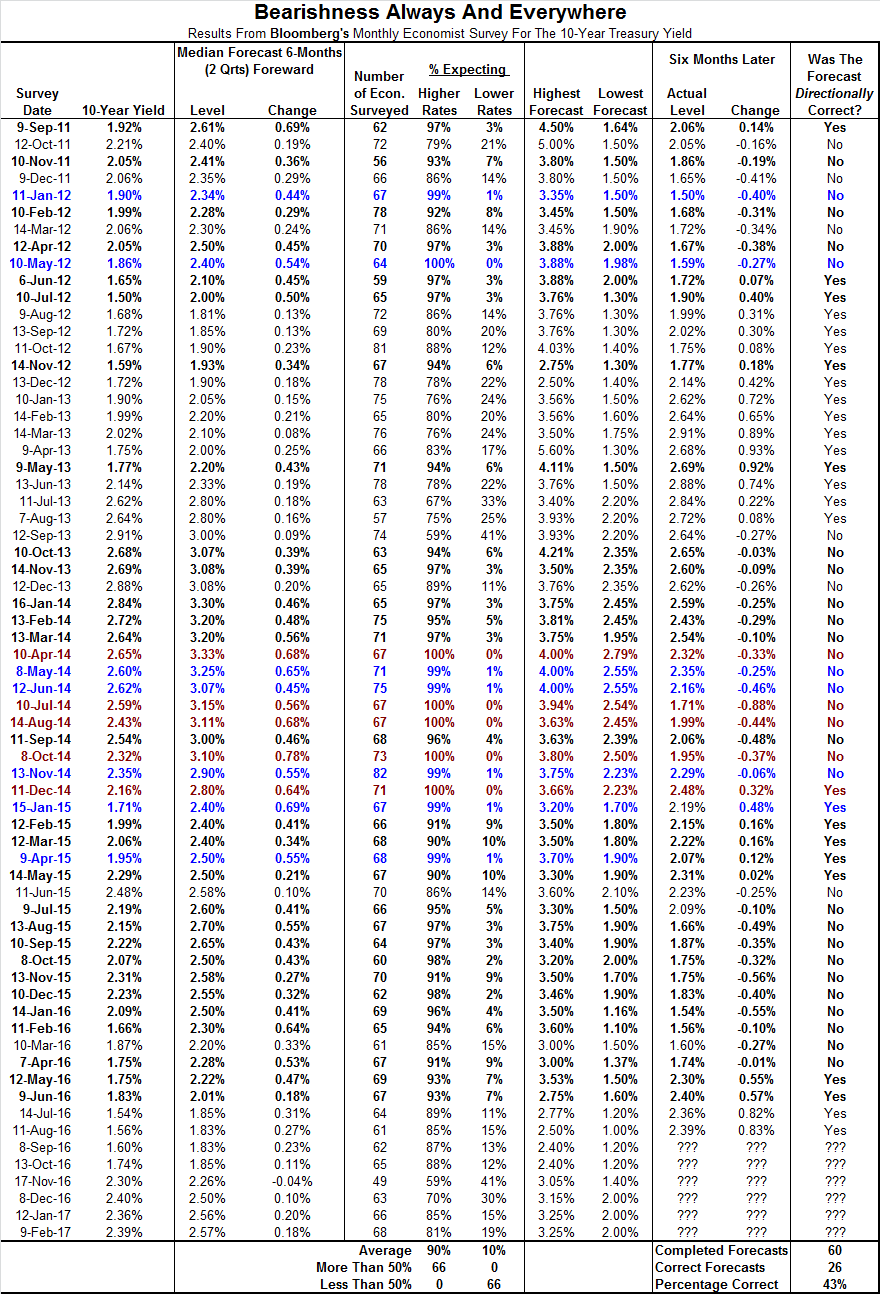
The table below shows the results from Bloomberg’s survey of interest rate forecasts six months forward. The latest survey shows economists’ 10-year forecasts for June 30, 2017. Since September 2011, economists have only predicted falling rates once – in the wake of the Trump election. Even then, the consensus only expected a fall of 4 basis points in 10-year yields. However, it should be noted that the majority of economists (59%) still expected higher yields on that date.
On average, 90% of respondents expect higher yields on any given month. In fact, it is not uncommon for 99% or 100% of economists to expect higher rates. In reality, interest rates only rose 43% of the time in the six months following each survey.
Given the structural bearishness among economists, it is difficult to lend them much credence when it comes to forecasting interest rates.
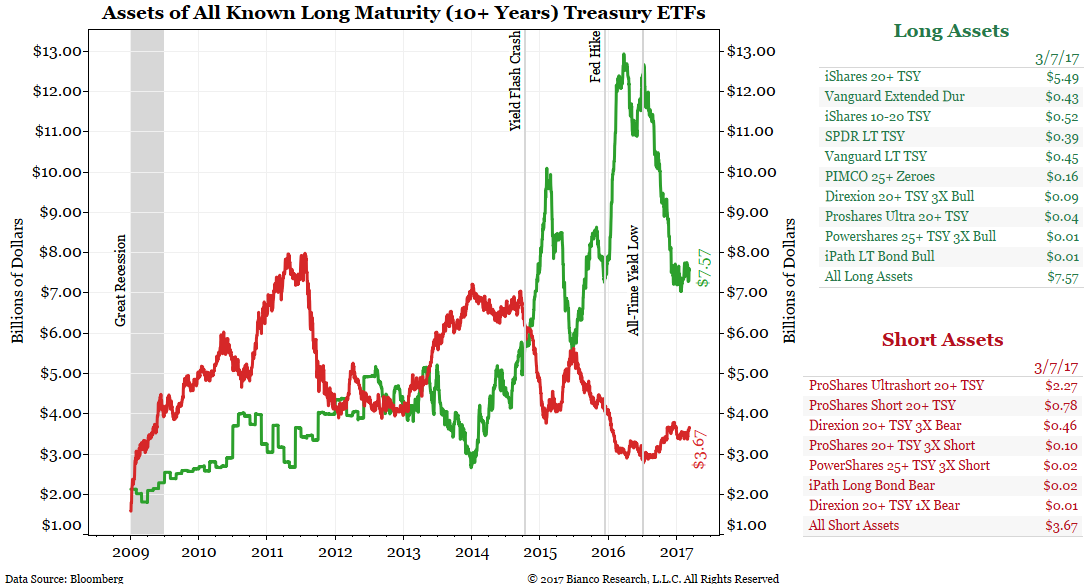
The next chart shows the assets in long-term Treasury (10+ years) ETFs. Assets in long-only ETFs are shown in green while short-only ETF assets are shown in red. After the Fed hike last year, assets in long Treasury ETFs soared. In the wake of the election this trend has reversed.
Sentiment has definitely shifted more bearish, but these measures are not at extreme levels.
The next series of charts come from the Commitment of Traders (CoT) report which offers a breakdown of open interest in the futures market. The net positions of hedgers are shown in blue, the net positions of large speculators are shown in red and the net positions of small traders are shown in green. Each category’s definition is listed on the chart.
This report helps decipher who is long and who is short. Back-testing shows the large speculators are often caught at their most extreme position when markets move against them and are thus a good contrarian indicator. Hedgers are usually on the right side of the next market move. We look at these reports from the large speculators’ point of view to help determine which markets may be overbought or oversold.
The first chart shows a breakdown of the open interest of the 10-year note futures contract. Since the election, large speculators have aggressively shorted this market. The chart shows this group is still at its most extreme net short position in the 24 years of history available. Contrarians would argue this is very bullish.


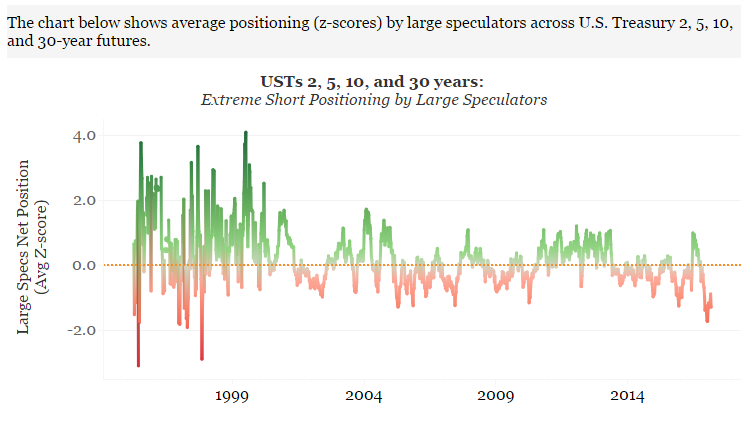
The charts above show speculators’ nominal net positions (longs less shorts). The chart below aggregates the net positions of large speculators in the 2-year, 5-year, 10-year and 30-year futures contracts. We normalize these measures two ways:
- Large speculators’ net positions are measured as a percentage of overall open interest. This helps compare current net positions to those of a couple decades ago when markets were much smaller.
- The measures are then converted to Z-scores. This is simply the number of standard deviations the current net position is from a 5-year moving average.
By normalizing the data in this way, we are then able to compare contracts of different tenors and leverage ratios and aggregate them to get a better sense of speculators’ net position on “interest rates.”
The chart below shows large speculators’ net position across these tenors has retreated a bit from the largest net short in the history of the data set. It is, however, still one of the larger net short positions on record. Again, this group should be seen as a contrarian indicator, so their expectation of higher rates should be looked at with some skepticism.
Conclusion
- Professional forecasters and economists are very bearish, but they always are.
- Fixed income managers, as surveyed by JP Morgan, are now neutral, but have leaned bearish the last few months.
- Asset levels in long and short Treasury ETFs are neutral but rapidly moving toward a bearish stance.
- Large speculators in 10-year futures currently hold a near-record bearish net position.
- Large speculators in Eurodollar futures currently hold a record bearish net position.
- A normalized measure of large speculators’ aggregate net position in 2-year, 5-year, 10-year and 30-year futures contracts are also near a record bearish level.
Regardless of which group is being examined or how the data is broken down, there seems to be a nearly universal bearish opinion in the bond market. All these measures are considered contrarian in nature, so the data above suggests the bond market should rally and rates will turn lower.