- The Wall Street Journal – Short-Dated U.S. Bond Yields Hit Post-Crisis High on Fed Anxiety
Fed Chairwoman Yellen is scheduled to speak Friday
The bond market is finally getting real to the possibility of a Federal Reserve interest rate increase in two weeks.Investors this week have been selling Treasurys that tend to lose value when the central bank tightens monetary policy. On Thursday, the selling pressure sent some short-term bond yields that are highly sensitive to the Fed’s outlook to post-crisis highs. - The Wall Street Journal – Futures Traders Not Looking Far Ahead of Fed’s Possible March Rate Rise
A surge in bets on an increase soon hasn’t come with a discernible shift in expectations of further moves
Investors may be increasingly sure the Federal Reserve will raise interest rates this month, but they haven’t yet reconsidered what happens next.That, at least, is the message coming through from the futures market. There, the sudden surge this week in bets that the Fed will lift rates by a quarter percentage point on March 15 hasn’t come with any notable shift in expectations for how many further increases there will be in the next couple of years.
Comment
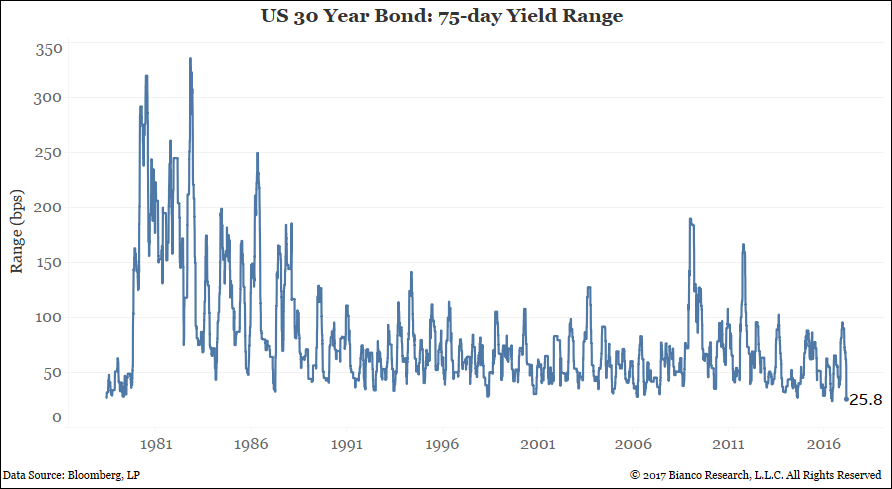
The chart below shows the U.S. 30-year bond’s trading range (max – min yield) over rolling 75-trading day periods.
After reading the first story above, would you believe the U.S. 30-year bond’s yield has been stuck in its second tightest trading range since 1980?! The bond’s tightest 75-trading day range occurred just recently, in June 2016 (23.9 bps).
More distant expectations beyond 2017 for the fed funds rate and U.S. Treasury yields have yet to move appreciably higher. The U.S. 5-year less 30-year spread (last: 103.9 bps) is threatening its flattest levels since before the financial crisis.
The chart below shows changes in U.S. 30-year bond yields days after bullish (top panel) and bearish (bottom panel) breakouts from similar trading ranges.
Direction may be difficult to predict, however amplified volatility looks very likely.
We believe the persistent discussion of ‘uncertainty’ in Fed speak is helping weigh down the path of long-term interest rates and flattening the yield curve.
The chart below shows the use of ‘weakness’ related words versus ‘inflation and growth’ related words in all Fed speeches since 1996. Each circle represents the sum of words for each quarter. Brainard’s hawkish speech is included.
The FOMC is beginning to show conviction with a higher use of inflation and growth relative to weakness.
The next chart shows the use of ‘uncertainty’ related words in all Fed speeches since 1996. We use z-scores (standard deviations from average) for a rolling 20-day sum of speeches.
The FOMC is exuding uncertainty at a high rate relative to inflation and growth. Long-term interest rates will likely remain lower relative to their short-term counterparts until the FOMC removes this hedge of ‘uncertainty.’
Will Fischer and Yellen finally start a trend of greater certainty? Or will confusion over long-term expectations continue?