- Zacks – Is Oil Driving Q1 Earnings Estimates Lower?
It has been the usual practice for quarterly earnings estimates to come down ahead of the start of each earnings season. This trend has been particularly notable over the last couple of years as management teams have been consistently providing weak guidance, causing estimates to come down. One could cite a variety of reasons for why this has been the norm lately, but the most logical though cynical explanation is that management teams have a big incentive to manage expectations. After all, it pays to under-promise and over-deliver.
Comment
<Click on chart for larger image>
Note that this trend has been fairly consistent over the past several years. While the overall percentages vary, the trend always show more companies beating estimates given the day before an earnings release than those given 120 days prior.
<Click on chart for larger image>
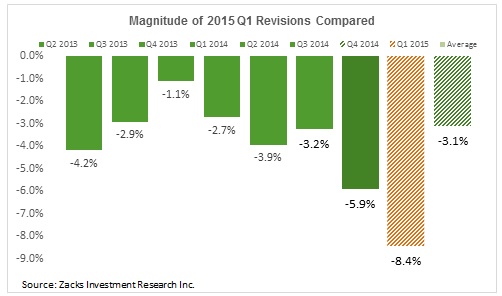
With Q4 earnings now largely in the rearview mirror, the markets will begin to focus on Q1 2015 earnings season. Alcoa will officially start us off on April 8. As this process gets underway, results must be gauged in light of already lowered estimates from analysts.
We have covered the gamed nature of earnings estimates many times in the past. In a nutshell, analysts often offer more optimistic earnings estimates early in a quarter only to be guided lower by company guidance as the actual quarterly release draws closer.
Knowing this tendency, we ran the following study in an attempt to analyze the accuracy of earnings estimates at various periods throughout the earnings season. The results of the study can be seen in the next two charts.
The first chart highlights the most recent earnings seasons. The X-axis shows the number of days prior to a company’s earnings release. T-120 denotes the period of time 120 days prior to an earnings release while T-1 denotes the day prior to an earnings release. The Y-axis shows what percentage of companies beat the earnings estimates from that given period of time.
In other words, of the 500 S&P companies in the index, roughly 67% beat their earnings estimates given by analysts the day before actual release. This fact has been covered by the media for quite some time. However, less than 50% beat the earnings estimates offered by analysts 120 days prior to release
The trend in these series is another way of showing the gamed nature of earnings. While analysts undoubtedly gather more information as a quarterly release draws near, allowing them to offer a more accurate estimate, perhaps earnings estimates are more honest 120 days prior to an actual earnings release since the percentage of companies that beat estimates vacillate around 50%. Presumably this would be the time that analysts would be able to offer their opinion without much influence from company guidance.
As of 90 days before an earnings release, however, companies have a chance to offer guidance in the previous quarter’s conference call. Regardless of which quarter is being examined, the trend shows a big jump in the percentage of companies that beat estimates as of 90 days prior to the actual release.
Once companies are done offering this guidance, these percentages typically stabilize until roughly 20 days prior to an earnings release. The final uptick in these series could possibly be due to companies making one last push to guide analysts’ expectations lower.