- Seeking Alpha – QE Never Left Us: The U.S. Economy And Stocks Will Grow Faster And Higher
– QE is still with us. It will help propel the U.S. economy and U.S. stocks forward in 2015.
– Massive stocks of liquidity accumulated during the QE era will increasingly be deployed toward purchases of goods as liquidity preferences decline.
– Liquidity is still growing from elevated levels as a result of accelerated real credit growth.
On October 29, 2014, the US Federal Reserve officially announced the termination of its quantitative easing (QE) policy – as had been widely anticipated for many months prior. In the lead-up to and immediate aftermath of the termination of QE, a great many commentators in the financial media predicted doom for the US economy and stock market as a result of the termination. These predictions were based on the erroneous inference that the growth of the economy and gains in stock indices such as the S&P 500 and the Dow Jones Industrial Average during the prior years had been primarily due to QE. It also was based on a completely misguided theoretical understanding of how QE impacts the economy and the stock market. QE was an operation that injected liquidity into the US economy. In its initial phase, it was merely replacing liquidity that was destroyed during the financial crisis. However, in later iterations, QE brought about a historically unprecedented accumulation of liquidity relative to the normal requirements of the US economy. As I detailed in this article, US businesses and households (particularly the wealthiest households) in the aggregate are currently holding record amounts of liquidity relative to their incomes. More specifically, the total stock of liquidity accumulated by households and businesses surpasses by record amounts what they need under normal economic conditions.
- The Financial Times – US small-cap stocks return to favour
After a trying 2014, US small company stocks are back in favour. Investors and strategists have warmed to the US small-cap sector — sending it to an all-time high this week — as valuations have become more appealing, despite the looming threat of tighter policy from the Federal Reserve and a slide in energy prices. While investors have yet to start a large-scale shift into the asset class, many now see an opportunity for the group that has registered nearly $31.5bn of withdrawals over the past 14 months, according to data from EPFR. In the latest week, investors increased positions in small-caps by $31m, a small wager that the strengthening US economy will prove the main global growth engine this year. The S&P 600 small-cap index and Russell 2000, home of the country’s small publicly traded businesses, have started the year on a positive footing after erratic trading in 2014 saw each lag the large-cap S&P 500.
Comment
<Click on chart for larger image>
<Click on table for larger image>
<Click on chart for larger image>
<Click on table for larger image>
<Click on chart for larger image>
<Click on table for larger image>
<Click on chart for larger image>
<Click on table for larger image>
<Click on chart for larger image>
<Click on table for larger image>
<Click on chart for larger image>
<Click on table for larger image>
<Click on chart for larger image>

<Click on table for larger image>
<Click on chart for larger image>
<Click on table for larger image>
Comment
See below for additional charts:
[pageview url=”https://www.biancoresearch.com/bianco/wp-content/plugins/PDFViewer/plugin.php?id=244″]
Easier financial conditions will promote economic growth. For example, lower mortgage rates will make housing more affordable and allow more homeowners to refinance. Lower corporate bond rates will encourage investment. And higher stock prices will boost consumer wealth and help increase confidence, which can also spur spending. Increased spending will lead to higher incomes and profits that, in a virtuous circle, will further support economic expansion.
Ben Bernanke, Washington Post Op-Ed, November 4, 2010
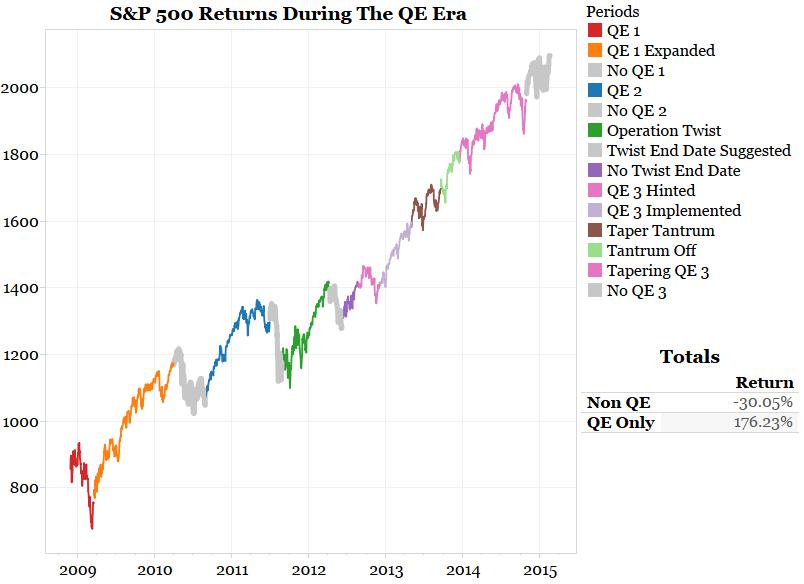
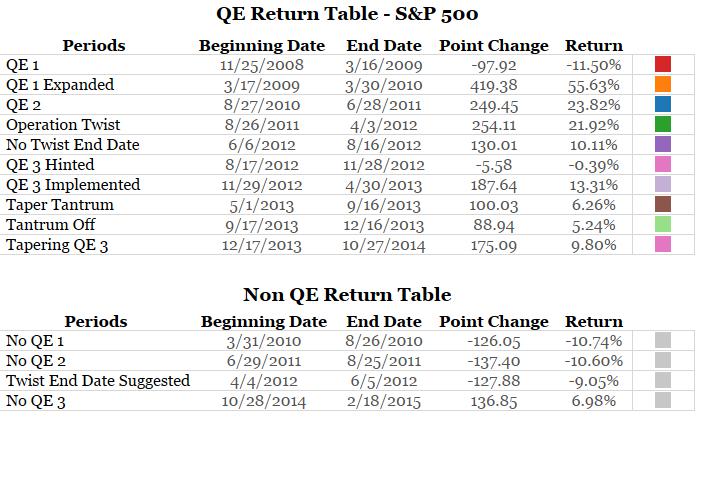
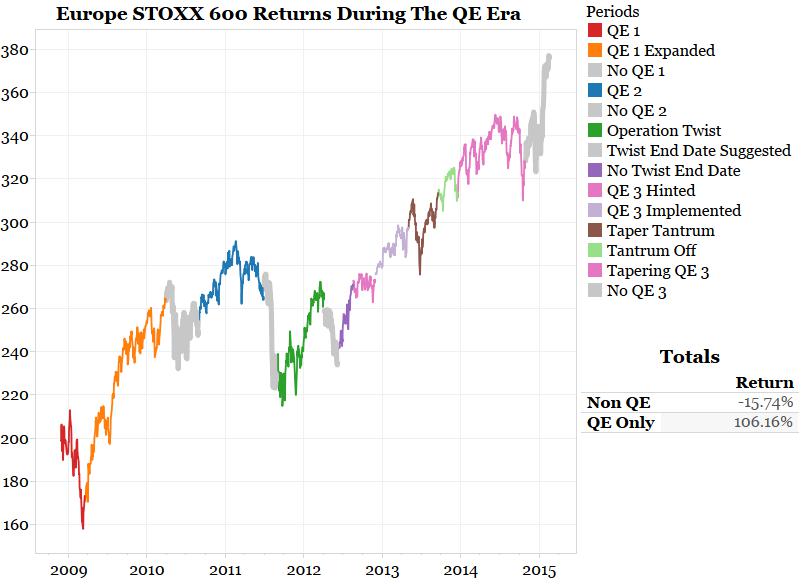
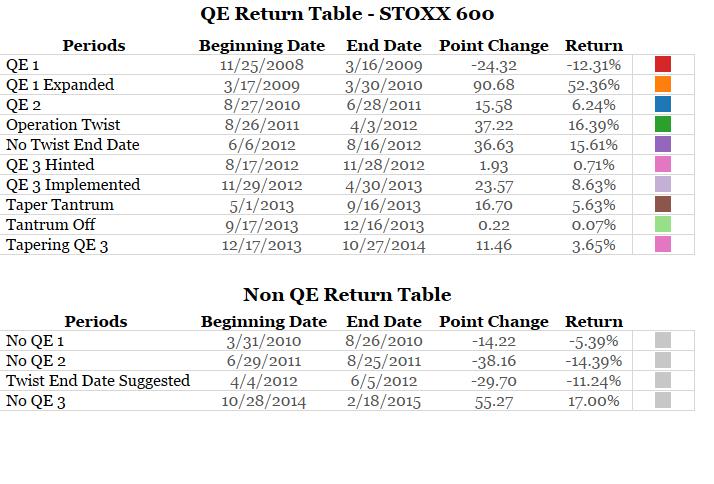
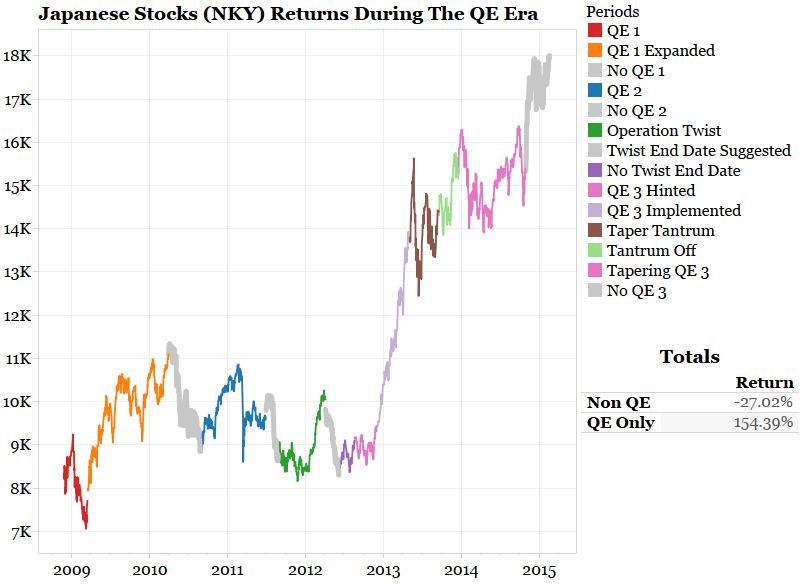
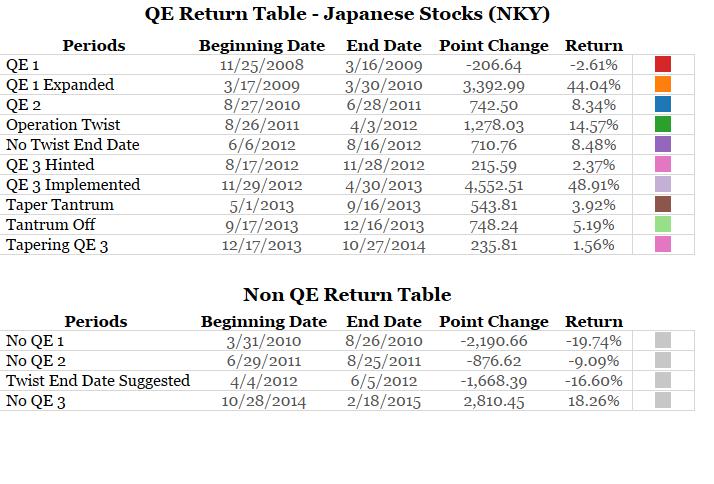
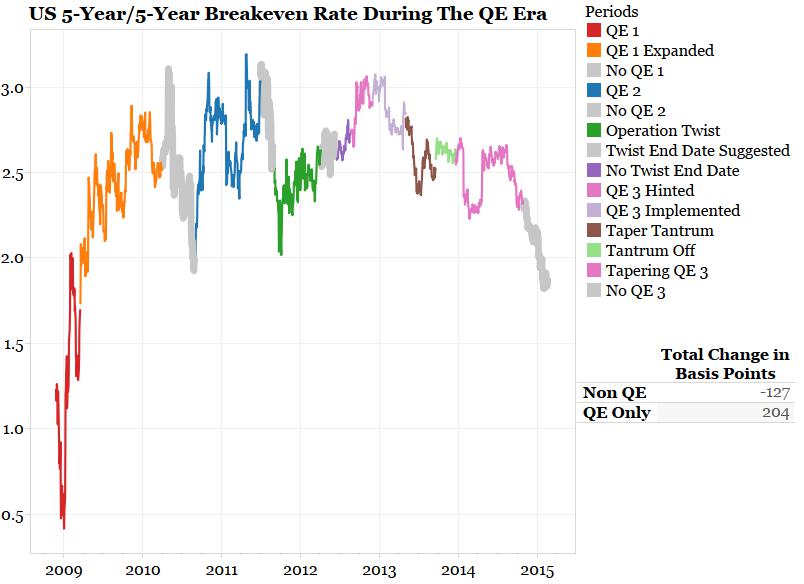
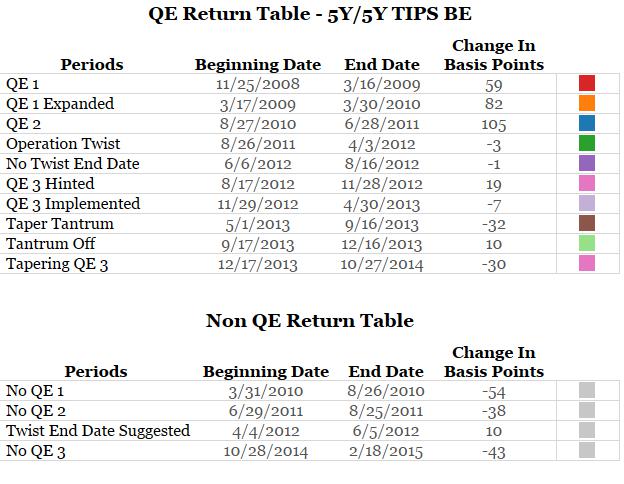
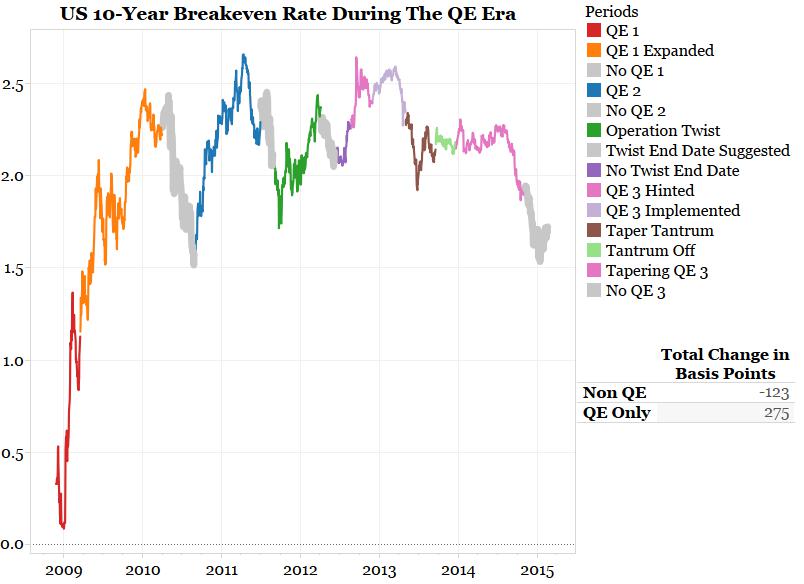
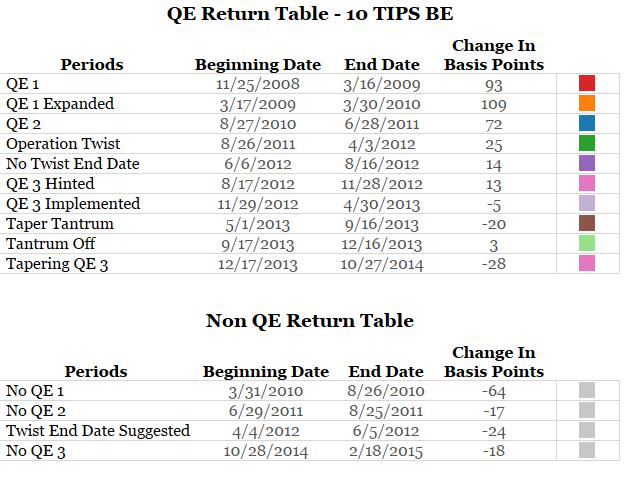
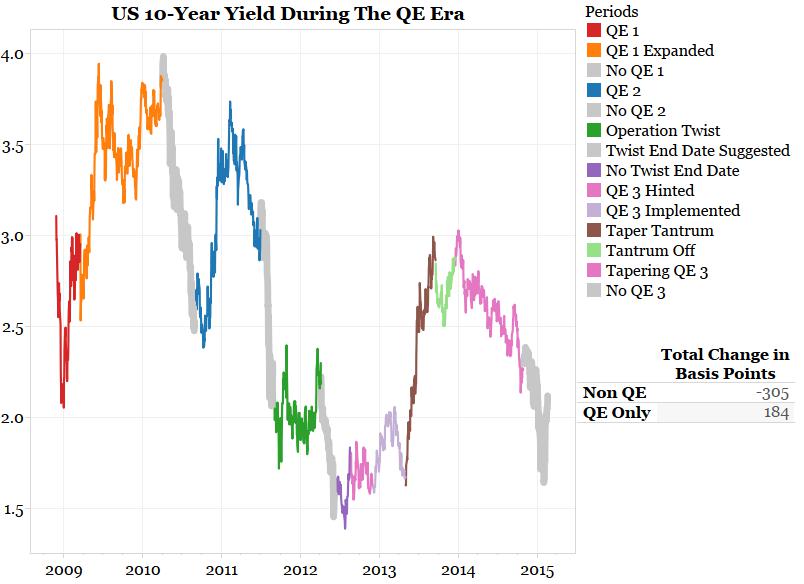
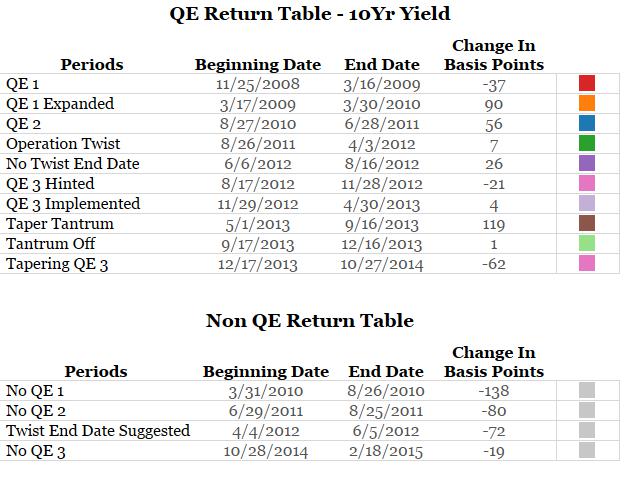
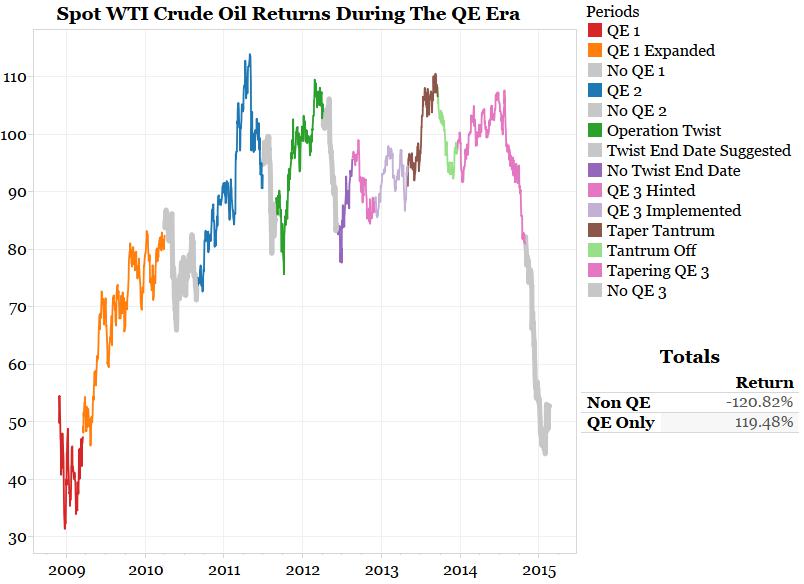
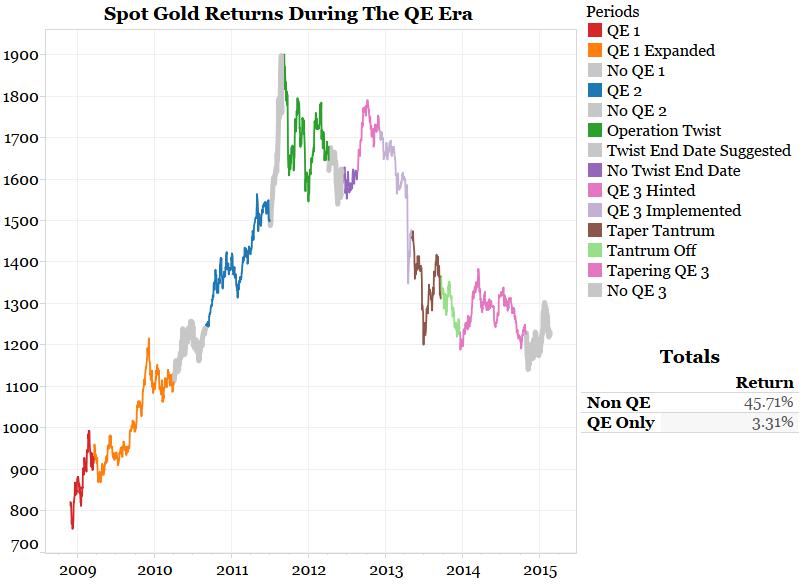
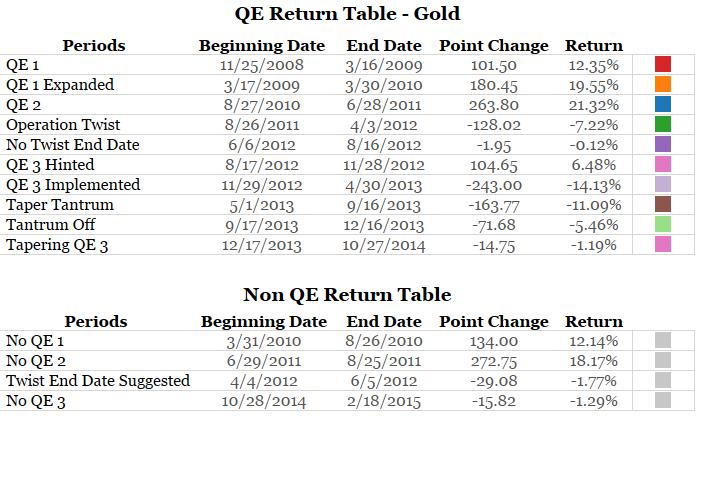
Bernanke’s statement above lays out the purpose of QE as he saw it. It is all about the stock market and creating a wealth effect. So how effective has QE been in moving stocks? Below are some charts detailing market performance during both QE and non-QE periods. A complete set of 29 different markets can be found in the embedded presentation below.
The charts are color-coded for the various QE periods (explained below). All QE periods are given a color while non-QE periods are shown in gray. A complete explanations of how we picked these exact dates can be found here.
To state the obvious, QE certainly made a difference for most markets. They react one way when QE is present and another way when it is not present. The charts below quantify this. That has even been the case since QE stopped on October 28, 2014.