<Click on chart for larger image>
- The Wall Street Journal – January U.S. Auto Sales Held Strong
Fueled by low gasoline prices and easier credit, the U.S. auto industry pulled its recent winning streak into 2015 with a projected 15% monthly increase compared with the same period a year ago. January’s volume suggests annual auto sales are tracking well above the pace set last year. General Motors Co. , Ford Motor Co. and Fiat Chrysler Automobiles NV all notched year-over-year increases in excess of 13%, and major Japanese auto makers had similar gains in what is typically a slower month for sales. “Consumers feel good because more people are working, the U.S. economy is expanding and fuel prices are low, GM Sales Chief Kurt McNeil said. GM, which reports earnings for its fourth quarter on Wednesday, is riding the strong American car market to strong earnings momentum, helping offset weakness abroad. While January was hot, it was a bit weaker than the headline numbers suggest due to one more selling day in 2015 than 2014. And, the comparison to January 2014 was further aided by the storms and cold spell that crippled large parts of the nation a year ago. Overall results of U.S. auto sales for the month are still being tallied and expected to be available later on Tuesday. The annualized pace of sales is projected to have increased 8.4% during the month, according to analysts at Morgan Stanley . If that rate holds through the year, U.S. auto sales will exceed 17 million for the first time in more than a decade. The fundamentals of the industry remain strong, analysts and auto executives said. Auto makers, helped by plant closures and restructuring during the recession, are now in a far stronger position to manage fluctuations in production demands.
Comment
<Click on chart for larger image>
- The Motley Fool – The Average American Drives This Much Each Year — How Do You Compare?
According to data from the U.S. Department of Transportation, the average American driver puts in 13,474 miles behind the wheel each year. However, you might be surprised to learn that men spend much more time behind the wheel than women: the average American male drives 16,550 miles each year, while the average American female logs just 10,142 miles in a given year. That’s 63% more miles for men, suggesting that perhaps women have discovered how to take a more efficient route everywhere they go (said with tongue-in-cheek). At face value there is certainly a gap between the sexes, but there are greater trends at play. Not only is there quite a difference between the miles driven by men and women, but there’s a very pronounced difference by age range. As we see in the chart below, miles driven per year peaks in the 35-55 age bracket for men while mileage driven for women peak in the 20-34 age bracket.
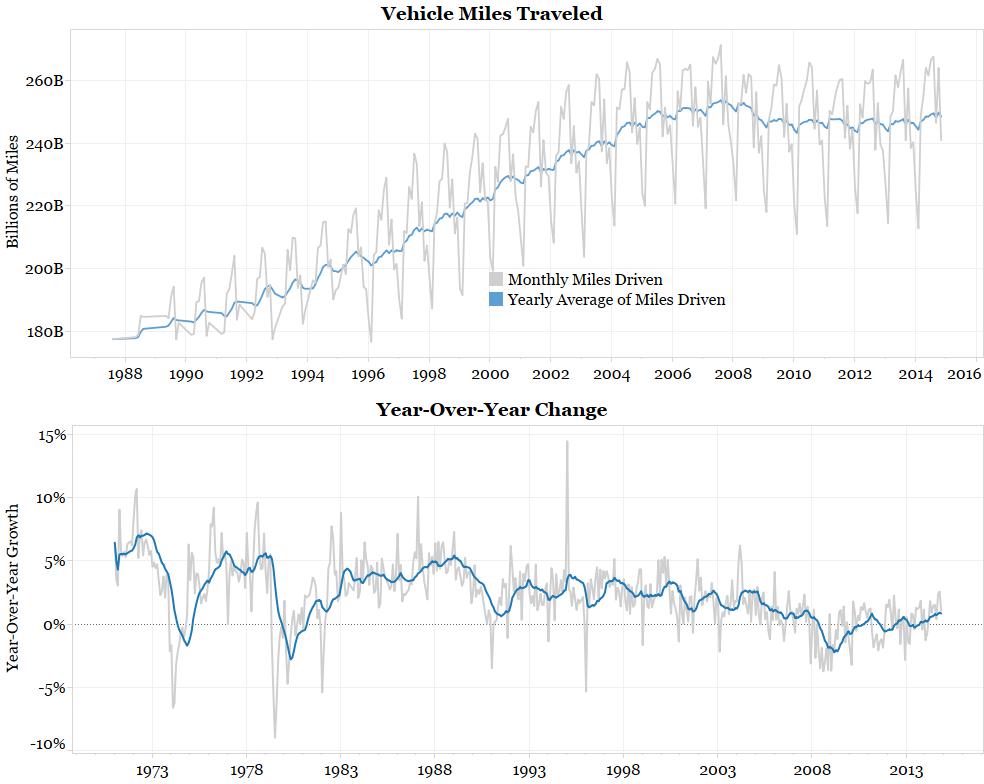
Vehicle miles traveled is a metric complied by the Department of Transportation. The chart below starts in 1970. The top panel shows the number of miles driven by all Americans on a monthly basis (gray line) and the average monthly miles driven over the previous year (blue line). Note that driving is a highly seasonal affair. We drive more in the summer and less in the winter. The second panel shows the year-over-year change of each measure.
Data for miles traveled goes back to 1919 (chart on page 54) or the invention of the model T. From 1919 to 2007 the number of miles traveled increased steadily except for the periods surrounding WW2 gasoline rationing and the 1970s oil crisis. But even in these periods the setback was temporary and the upward trend continued as Americans’ love of automobiles was not shaken.
As the chart below shows, since 2007 the number of miles traveled has plateaued (blue line top panel) and the growth of miles traveled is near zero. Initially it was thought that the high unemployment rate following the Great Recession/financial crisis was the reason for this stagnation. After all, the biggest reason to use a car is to commute to work. But this metric has stagnated for 7 years now and the unemployment rate is down substantially over that time frame.
To put it another way, car usage is now a zero-growth industry, so the boom in auto sales has the appearance of a replacement cycle rather than real growth.
Given this, what is the better economic indicator? Should we focus on strong auto sales or the stagnation in miles driven for the first time in a 100 years? While we can make a good case for both, the fact that they give us vastly different answers leaves us with a confusing picture.