Summary
Comment
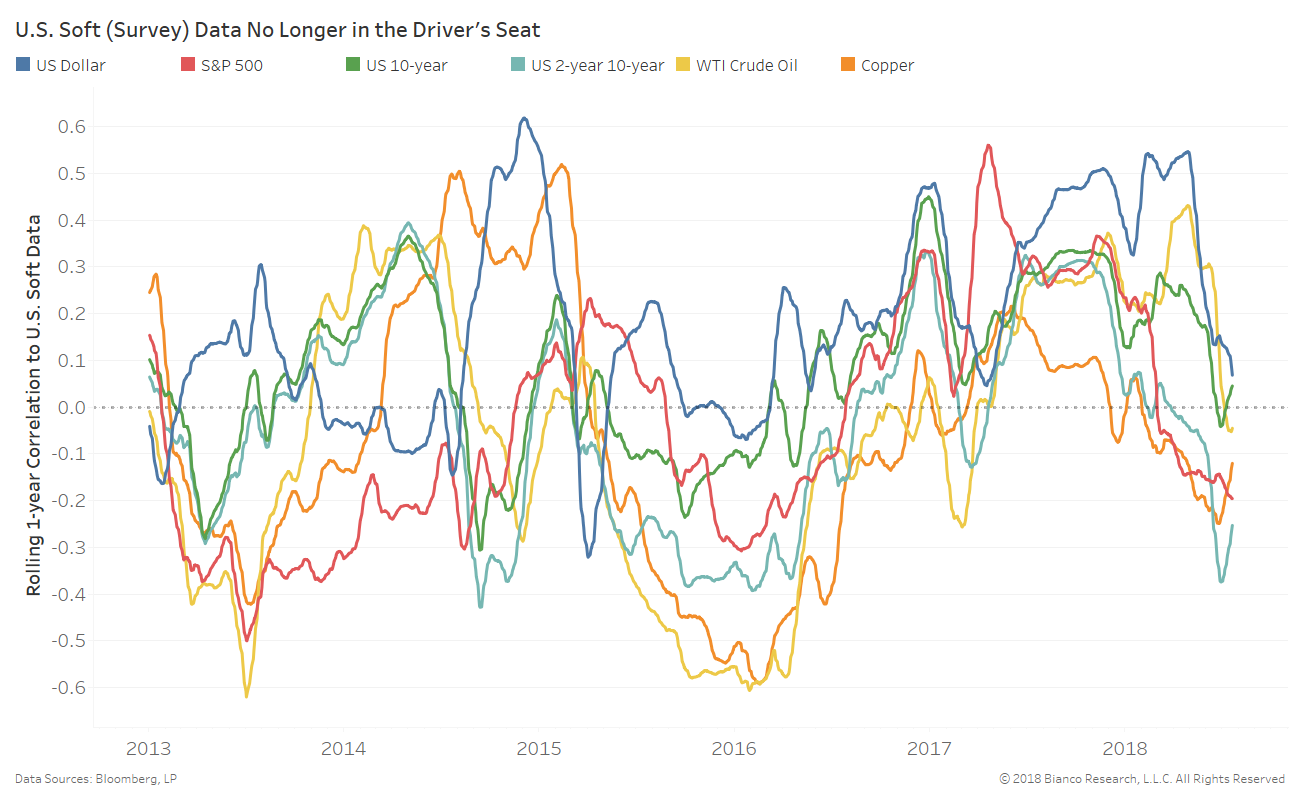
The chart below shows the rolling one-year correlation of major asset class returns to the U.S. Soft Economic Data Change index (Citigroup).
U.S. soft (survey) economic data has lost its positive correlation to major asset classes this summer. Business T.V. anchors and their guests may continue hyperventilating about sky-high consumer and business sentiment, but markets are no longer wowed. Risk markets have shifted attention back to inflation and central bank expectations.
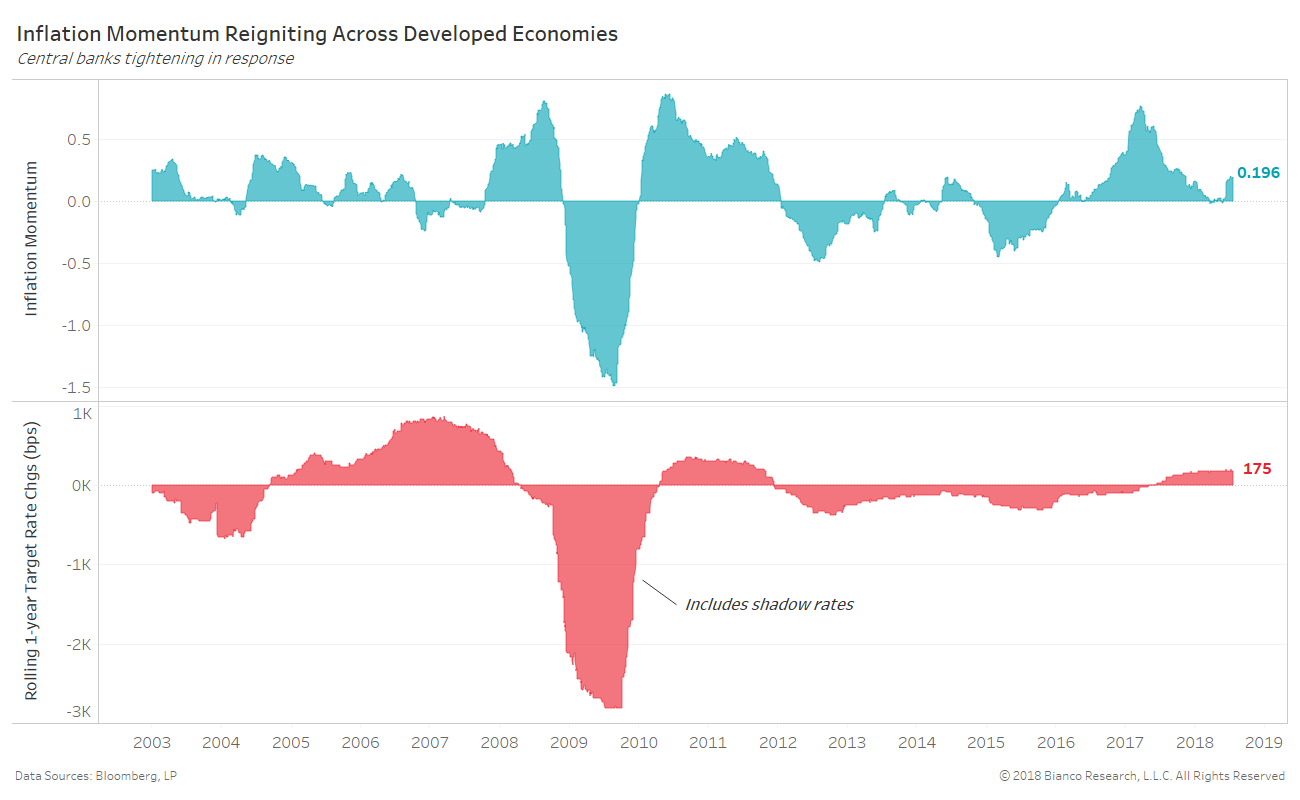
The next chart shows the momentum behind realized inflation across major economies in the top panel and summed rolling one-year changes in developed central bank target rates in the bottom panel. This inflation momentum index is a composite of incoming releases relative to one-year averages. Above-zero index values indicate above-average momentum and vice versa.
The momentum behind inflation is again rebounding after slowing in early 2018. Not surprisingly, developed central banks have raised rates by a total of 175 bps over the past year when including shadow rates. Remember, shadow rates translate balance sheet changes (flow) into rate changes. Stronger inflation momentum keeps the door very open for the ECB to join the party in 2019.
Implied volatility across U.S. Treasuries is nearing all-time lows, chasing realized volatility into the abyss. Strong demand from overseas given the U.S. yield offering the highest developed 10-year yield is helping keep volatility low.
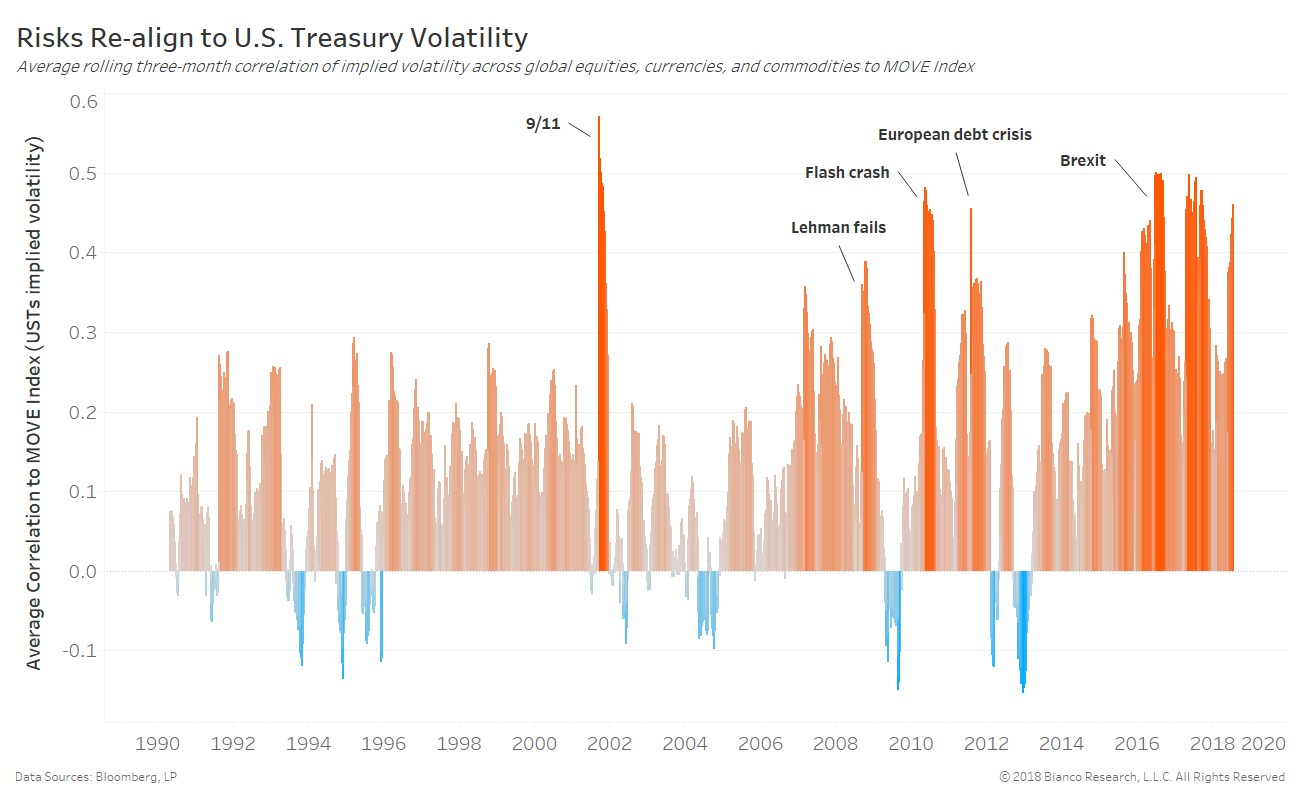
But, risks are again oddly reconnecting to the MOVE index. The chart below shows the average three-month correlation of implied volatility across a broad swath of risk assets (equities, currencies, and commodities) to the MOVE index.
Past similar periods of heightened connection to U.S. Treasury volatility have occurred during major geopolitical or market events like Lehman failing, the flash crash, and Brexit. We are again struggling to label higher correlations in the summer of 2018, just like the year prior.
Our belief is the market’s expectations for inflation and the ECB are steering nearly all markets. Investors have yet to fully buy into the rising inflation story with expectations stuck near the best levels of 2017. Additionally, the recent swoon in Eurozone economic data has quieted ECB rate hike talk. However rebounding inflation momentum and Eurozone economic data will likely revive both the inflation and rate hiking storyline into the fall of 2018.
Markets are clearly understanding this potential by aligning the embedded risks behind nearly all markets. There is currently nowhere to hide, just like mid-2017.