- The Financial Times – US earnings season sees play between hard and soft economic data
Signs are promising despite divergence in consumer confidence versus unemployment
A handful of big banks led by JPMorgan this week kicked off one of the more eagerly anticipated earning seasons in recent memory, with investors desperate for evidence that a revenue turnaround is gathering pace and the rotation back into technology is justified. Hopes are high. Headline earnings per share for the S&P 500 as a whole is expected to expand 9 percent year on year this quarter, the fastest growth since the third quarter of 2011. Assuming the usual number of results beat forecasts, the US blue-chip gauge will comfortably see a healthy double-digit earnings per share jump. But the closely watched metric will be flattered by the energy industry’s woeful start to 2016, which will make this quarter seem golden in comparison. Strip out that sector and EPS growth is expected to tick in at a respectable but more modest 5 per cent, which would actually be a slower pace of expansion than in the past two-quarters, David Kostin of Goldman Sachs notes.
Comment
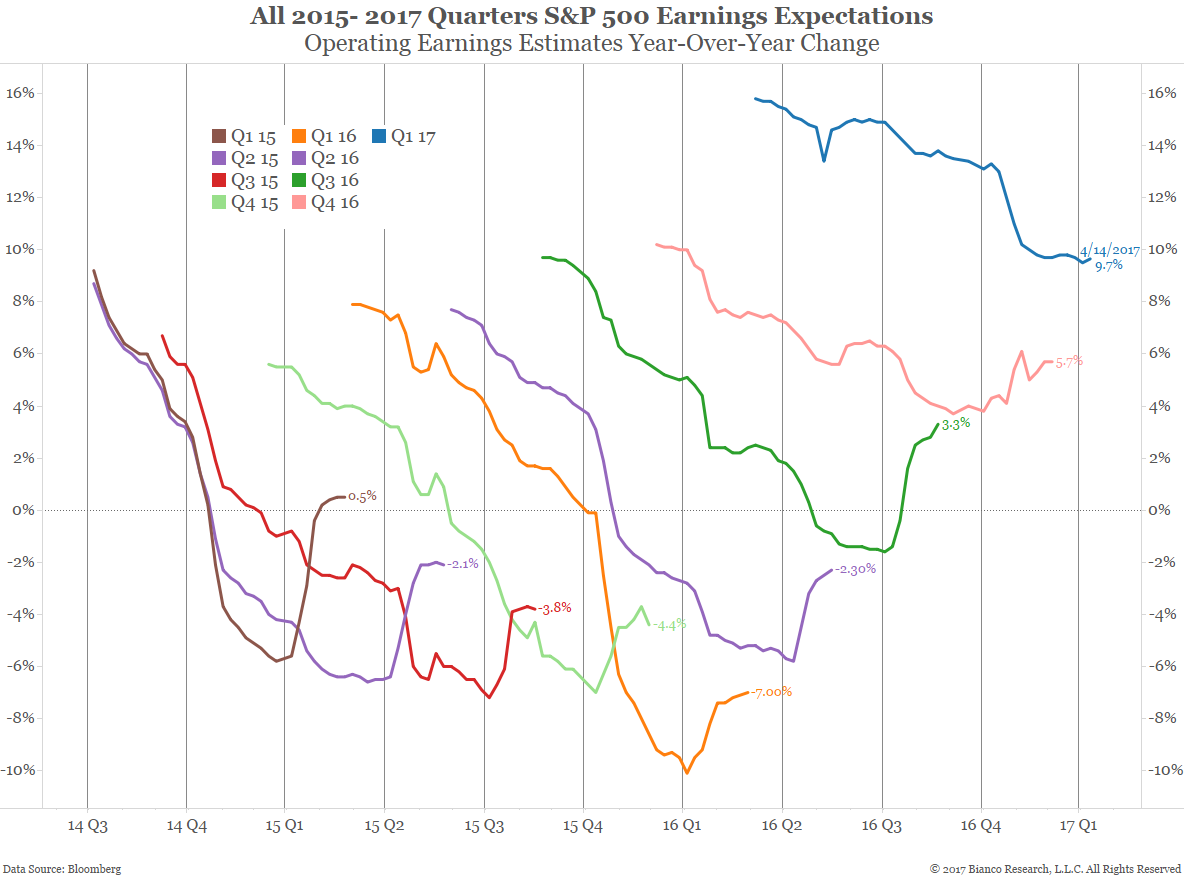
The chart below shows quarterly earnings estimates back to Q1 2015. Many on Wall Street are noting the huge jump in earnings estimates this quarter.
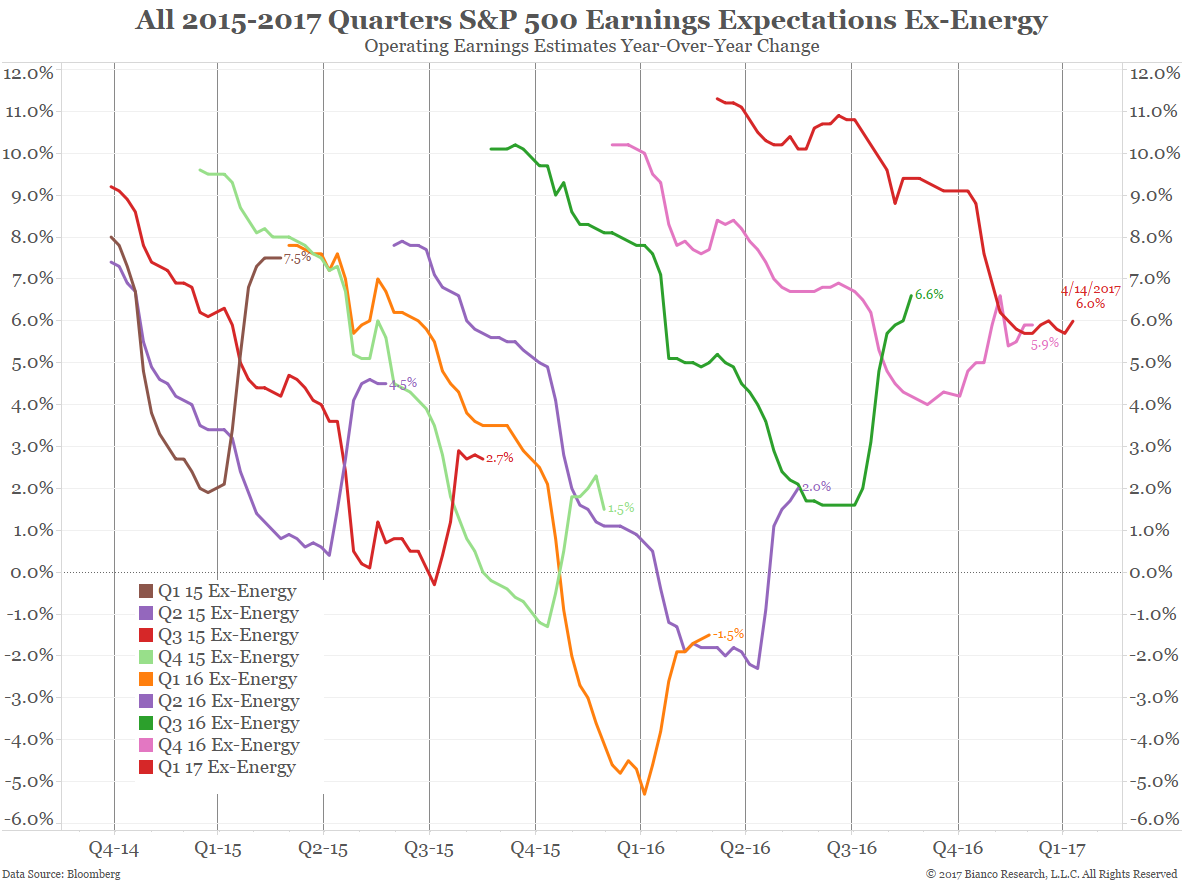
However, the next chart shows ex-energy earnings estimates since Q1 2015. When looked at from this perspective, earnings estimates have not improved much this quarter. Ex-energy earnings actually peaked in Q3 2016 (green) at 6.6%, fell to 5.9% in Q4 2016 (pink) and are expected to be roughly the same at 6.0% for Q1 2017 (red).
Take out the volatile energy sector and earnings for the rest of the S&P 500 are looking like they are topping in the mid-single digit range.
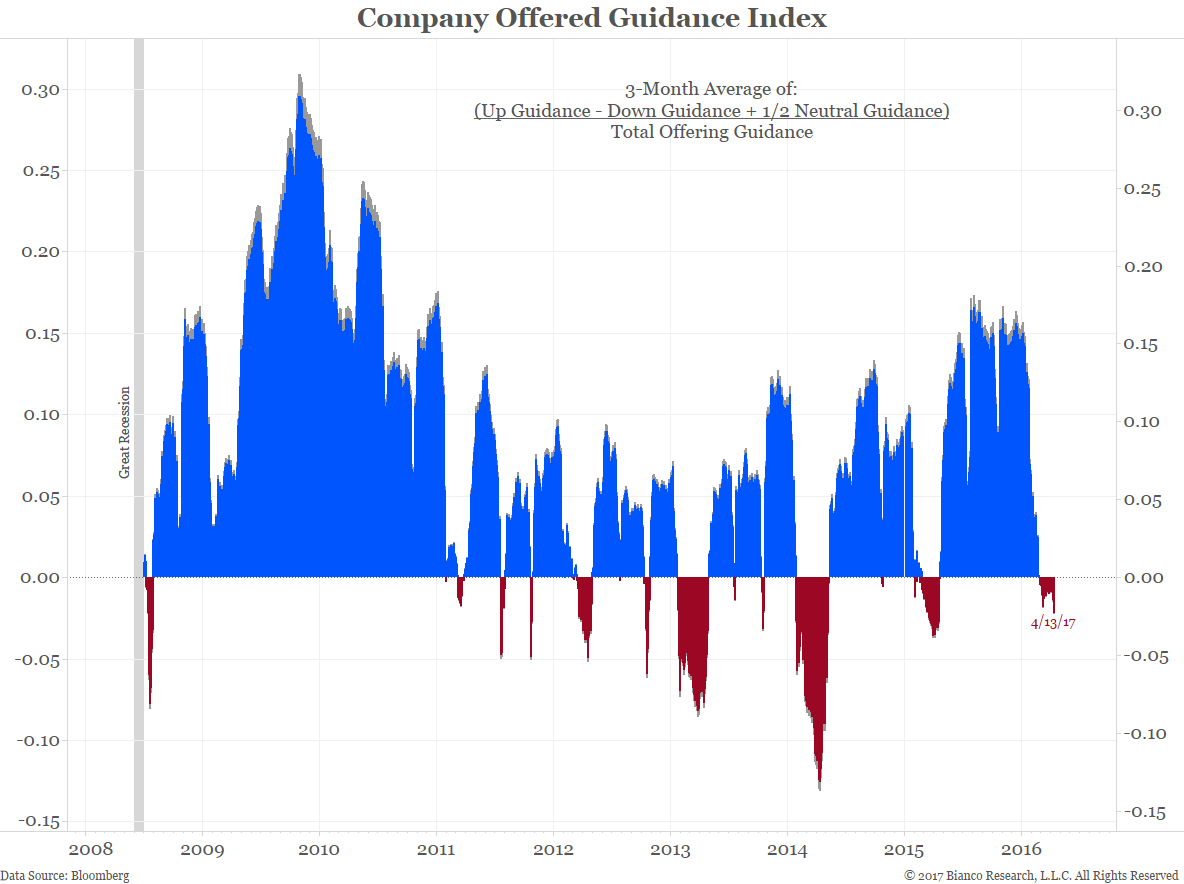
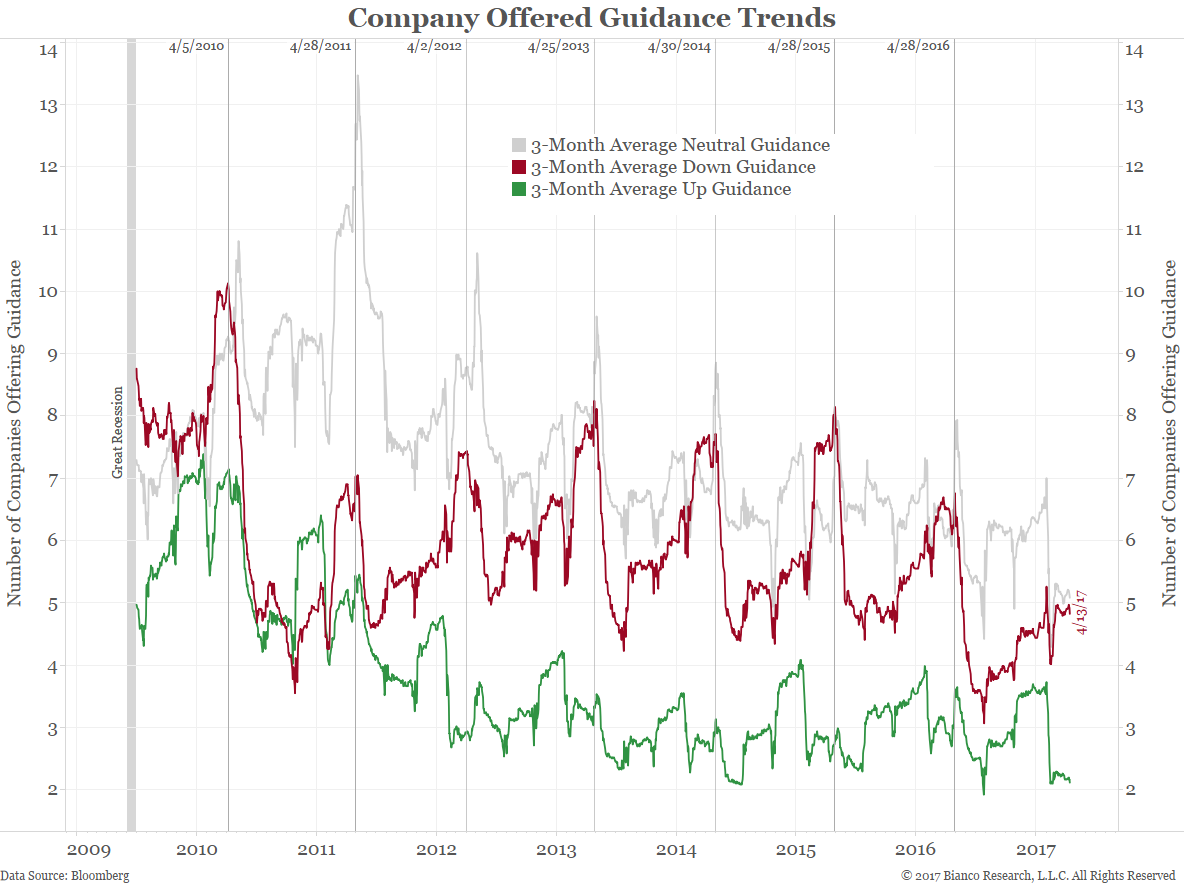
The charts above offer a historical look at earnings. The market is often more concerned about forward-looking measures like guidance. The next chart shows the Company Offered Guidance Index. Its construction is noted on the chart. A 3-month average is used because the typical company will offer guidance once a quarter.
Note that the Guidance Index has turned negative.
The chart below shows the individual inputs used to create the chart above. Note the seasonal pattern. Companies typically offer more positive guidance in January (rising green line). However, by April, negative guidance is usually on the rise (rising red line).
Why is this? Does the optimism that comes with the beginning of the year give way to reality by spring? Are companies talking up their earnings prospects in January, right after year-end stock awards, so management can cash out with maximum profits?
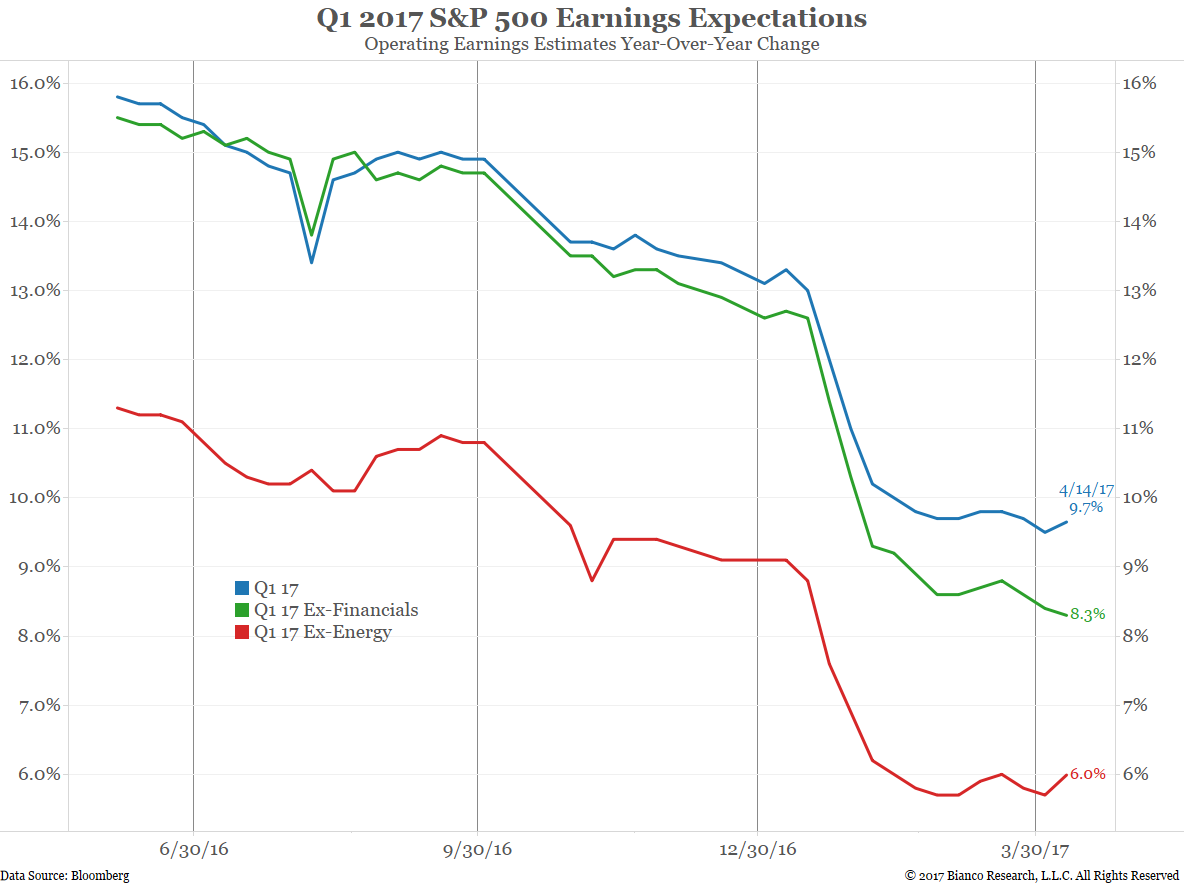
Through Friday only 29 of the S&P 500 have reported Q1 2017 earnings. The chart below shows blended earnings estimates, meaning it uses the 29 actual reports and the median estimate of Wall Street analysts for the 471 that have not yet reported.
Analysts currently expect year-over-year operating growth to come in at 9.7% (blue). The S&P 500 has not seen double digit earnings growth since 2011. However, note that that ex-energy earnings is only expected to grow 6.0% year-over-year (red). Crude oil bottomed a year ago (February 11, 2016), so energy companies are contributing quite a bit to overall earnings.
Despite the fact that energy companies only account for 7.56% of S&P 500’s market capitalization, they alone are responsible for roughly 38% of the S&P 500’s Q1 2017 earnings.